## Scatter Plot with Error Bands: Accuracy vs. Deep-Thinking Ratio for Different Thresholds
### Overview
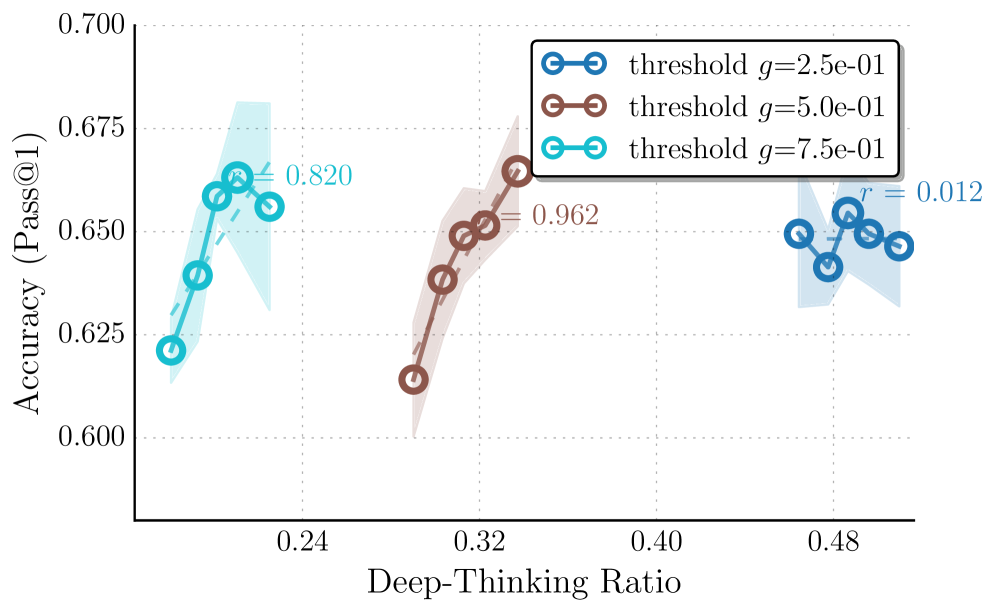
The image is a scatter plot chart displaying the relationship between a model's "Deep-Thinking Ratio" (x-axis) and its "Accuracy (Pass@1)" (y-axis). Three distinct data series are plotted, each corresponding to a different threshold value for a parameter labeled 'g'. Each series consists of several data points connected by a line, with a shaded error band around the line. The chart includes a legend, axis labels, and numerical annotations for correlation coefficients.
### Components/Axes
* **X-Axis:** Labeled "Deep-Thinking Ratio". The scale runs from approximately 0.16 to 0.52, with major tick marks labeled at 0.24, 0.32, 0.40, and 0.48.
* **Y-Axis:** Labeled "Accuracy (Pass@1)". The scale runs from 0.600 to 0.700, with major tick marks labeled at 0.600, 0.625, 0.650, 0.675, and 0.700.
* **Legend:** Positioned in the top-right corner of the plot area. It defines three series:
* **Blue line with circle markers:** `threshold g=2.5e-01`
* **Brown line with circle markers:** `threshold g=5.0e-01`
* **Cyan line with circle markers:** `threshold g=7.5e-01`
* **Data Series & Annotations:**
* Each series has a shaded region (error band) of the same color as its line, indicating variance or confidence intervals.
* A correlation coefficient (`r`) is annotated near each series.
### Detailed Analysis
**1. Cyan Series (`threshold g=7.5e-01`)**
* **Spatial Grounding & Trend:** Located on the left side of the chart (lower Deep-Thinking Ratio). The line shows a clear upward trend, starting low and rising steeply before a slight dip at the final point.
* **Data Points (Approximate):**
* (Deep-Thinking Ratio ~0.18, Accuracy ~0.620)
* (~0.19, ~0.640)
* (~0.20, ~0.655)
* (~0.21, ~0.665)
* (~0.22, ~0.660)
* **Annotation:** `r = 0.820` is written in cyan text to the right of the series, indicating a strong positive correlation between the Deep-Thinking Ratio and Accuracy for this threshold.
**2. Brown Series (`threshold g=5.0e-01`)**
* **Spatial Grounding & Trend:** Located in the center of the chart. The line shows a consistent, strong upward trend across all its points.
* **Data Points (Approximate):**
* (~0.29, ~0.615)
* (~0.30, ~0.640)
* (~0.31, ~0.650)
* (~0.32, ~0.655)
* (~0.33, ~0.665)
* **Annotation:** `r = 0.962` is written in brown text to the right of the series, indicating a very strong positive correlation.
**3. Blue Series (`threshold g=2.5e-01`)**
* **Spatial Grounding & Trend:** Located on the right side of the chart (higher Deep-Thinking Ratio). The line shows a scattered, non-monotonic pattern with no clear upward or downward trend. Points fluctuate up and down.
* **Data Points (Approximate):**
* (~0.46, ~0.650)
* (~0.47, ~0.640)
* (~0.48, ~0.655)
* (~0.49, ~0.650)
* (~0.50, ~0.645)
* **Annotation:** `r = 0.012` is written in blue text to the right of the series, indicating a negligible, near-zero correlation.
### Key Observations
1. **Distinct Clustering:** The three data series occupy distinct, non-overlapping regions along the x-axis (Deep-Thinking Ratio). Higher `g` thresholds (cyan, 0.75) are associated with lower ratios, while the lowest `g` threshold (blue, 0.25) is associated with the highest ratios.
2. **Correlation Gradient:** There is a dramatic decrease in the correlation coefficient (`r`) as the `g` threshold decreases and the Deep-Thinking Ratio increases. The relationship is strong and positive for high `g`, but vanishes for low `g`.
3. **Accuracy Range:** Despite the different trends and ratios, the peak accuracy achieved by each series is relatively similar, clustering between approximately 0.655 and 0.665.
4. **Error Band Width:** The shaded error bands appear relatively consistent in width across the three series, suggesting similar levels of variance in the measurements for each threshold.
### Interpretation
This chart investigates how a model's "Deep-Thinking Ratio"—likely a measure of computational effort or reasoning depth allocated to a problem—affects its pass@1 accuracy, under different operational thresholds (`g`).
The data suggests a **threshold-dependent relationship**:
* At a **high threshold (`g=0.75`)**, allocating more "deep thinking" (increasing ratio) is strongly beneficial, leading to higher accuracy. The model benefits from increased reasoning effort.
* At a **medium threshold (`g=0.50`)**, this positive relationship is even stronger and more consistent.
* At a **low threshold (`g=0.25`)**, the model operates in a high "deep-thinking ratio" regime, but here, additional reasoning effort shows no systematic benefit. Accuracy plateaus and fluctuates randomly. This could indicate a point of diminishing returns, where the model is already using maximum effective effort, or that the low threshold allows for a different, less efficient mode of operation where effort is not well-correlated with success.
In essence, the benefit of "thinking harder" is not universal; it is contingent on the system's operational threshold (`g`). The chart implies an optimal operating point exists at medium-to-high thresholds where effort translates effectively into performance.