## Scatter Plot: Accuracy vs Deep-Thinking Ratio by Threshold
### Overview
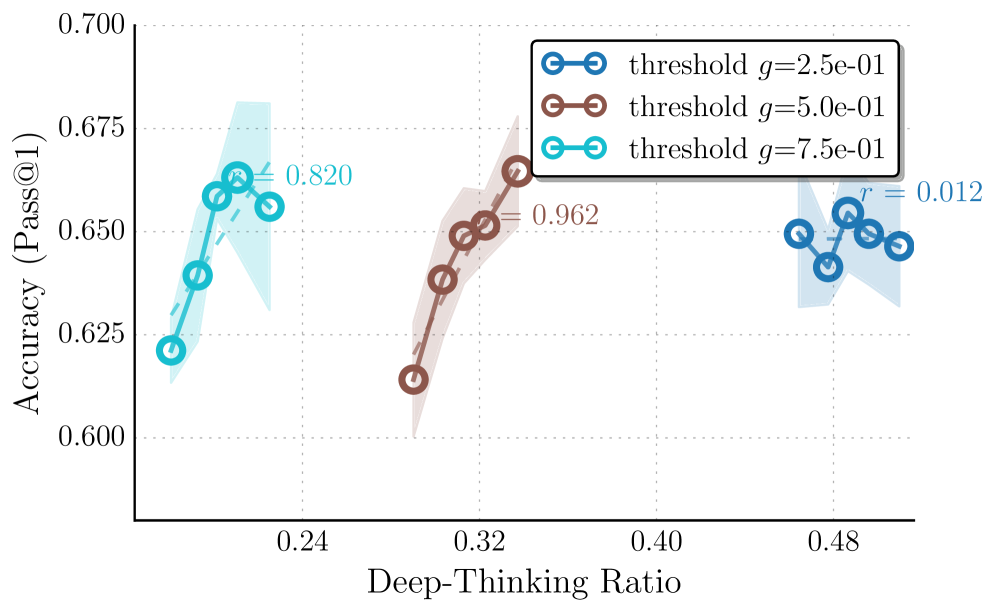
The image shows a scatter plot comparing accuracy (Pass@1) against deep-thinking ratio for three different threshold values (g=2.5e-01, g=5.0e-01, g=7.5e-01). Each threshold is represented by a distinct color-coded data series with connecting lines and shaded confidence intervals. The plot includes correlation coefficients (r-values) for each series.
### Components/Axes
- **X-axis**: Deep-Thinking Ratio (0.24 to 0.48)
- **Y-axis**: Accuracy (Pass@1) (0.600 to 0.700)
- **Legend**:
- Blue circles: threshold g=2.5e-01
- Brown circles: threshold g=5.0e-01
- Cyan circles: threshold g=7.5e-01
- **Annotations**:
- r = 0.820 (blue series)
- r = 0.962 (brown series)
- r = 0.012 (cyan series)
### Detailed Analysis
1. **Blue Series (g=2.5e-01)**:
- Positioned at x ≈ 0.48
- Accuracy range: 0.635–0.650
- Correlation: r = 0.820 (strong positive trend)
- Data points show moderate clustering with slight upward trend
2. **Brown Series (g=5.0e-01)**:
- Positioned at x ≈ 0.32
- Accuracy range: 0.625–0.660
- Correlation: r = 0.962 (very strong positive trend)
- Tight clustering with clear upward trajectory
3. **Cyan Series (g=7.5e-01)**:
- Positioned at x ≈ 0.24
- Accuracy range: 0.620–0.665
- Correlation: r = 0.012 (negligible correlation)
- Widely scattered points with no discernible pattern
### Key Observations
- The brown series (g=5.0e-01) demonstrates the strongest linear relationship (r=0.962) between deep-thinking ratio and accuracy
- The cyan series (g=7.5e-01) shows essentially no correlation (r=0.012) despite having the highest deep-thinking ratio
- All series exhibit similar accuracy ranges (0.620–0.665), but with varying distributions
- Confidence intervals (shaded areas) are widest for the cyan series, indicating greater uncertainty
### Interpretation
The data suggests that threshold g=5.0e-01 optimally balances deep-thinking ratio and accuracy, with the strongest predictive relationship (r=0.962). The threshold g=7.5e-01 appears ineffective at correlating these metrics, while g=2.5e-01 shows moderate effectiveness. The similar accuracy ranges across thresholds imply that performance differences stem primarily from deep-thinking ratio distribution rather than absolute accuracy levels. The strong correlation in the brown series indicates a potential causal relationship worth investigating further, possibly representing an optimal operational threshold for the system being measured.