## 3D Heatmap: Cow's Field of Vision
### Overview
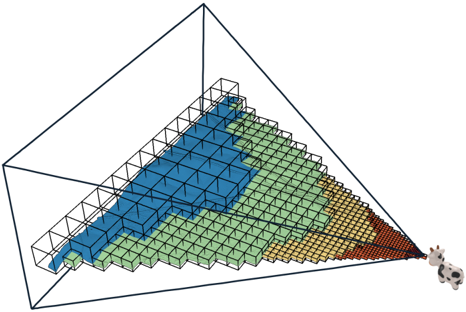
The image is a 3D heatmap visualizing a cow's field of vision. The heatmap is represented by a grid of cubes, with colors indicating the intensity or range of vision. The grid is contained within a triangular prism, and a small toy cow is positioned at the apex of the triangle, presumably representing the point of view. The colors range from blue (presumably low visibility) to red (presumably high visibility).
### Components/Axes
* **Grid:** A 3D grid of cubes forming the heatmap.
* **Colors:** The cubes are colored in a spectrum from blue to green to yellow to orange to red.
* **Prism:** A triangular prism encasing the grid.
* **Cow:** A toy cow positioned at the apex of the triangular prism.
* **Field of Vision:** The area covered by the grid represents the cow's field of vision.
### Detailed Analysis
The heatmap is structured as a grid of cubes, with the color of each cube indicating the intensity of vision at that point. The color gradient transitions from blue in the upper-left to green, yellow, orange, and finally red near the cow.
* **Blue Region:** The upper-left area of the grid is predominantly blue, indicating a low range of vision in that direction. The blue region extends approximately 10-12 cubes along the top edge and 6-8 cubes deep.
* **Green Region:** Adjacent to the blue region is a green area, indicating a moderate range of vision. The green region extends approximately 10-12 cubes along the top edge and 6-8 cubes deep.
* **Yellow Region:** The green region transitions into a yellow region, indicating a higher range of vision. The yellow region extends approximately 6-8 cubes along the top edge and 4-6 cubes deep.
* **Orange Region:** The yellow region transitions into an orange region, indicating a higher range of vision. The orange region extends approximately 4-6 cubes along the top edge and 2-4 cubes deep.
* **Red Region:** The area closest to the cow is red, indicating the highest range of vision. The red region extends approximately 2-4 cubes along the top edge and 1-2 cubes deep.
The grid is contained within a triangular prism, with the cow positioned at the apex of the triangle. This suggests that the cow's field of vision is wider at a distance and narrows as it approaches the cow.
### Key Observations
* The cow's field of vision is not uniform.
* The range of vision is highest directly in front of the cow and decreases towards the periphery.
* The blue region suggests a significant blind spot or area of low visibility to the cow's left.
### Interpretation
The 3D heatmap visualizes the cow's field of vision, demonstrating that it is not uniform. The color gradient indicates that the cow has the best vision directly in front of it (red region) and reduced vision towards the periphery (green and yellow regions). The blue region suggests a significant blind spot or area of low visibility to the cow's left. This visualization could be used to understand how a cow perceives its environment and to design environments that are safer and more comfortable for cows. The triangular prism shape reinforces the concept that the field of vision narrows as it approaches the cow.