## 3D Grid Diagram: Color-Coded Spatial Partitioning
### Overview
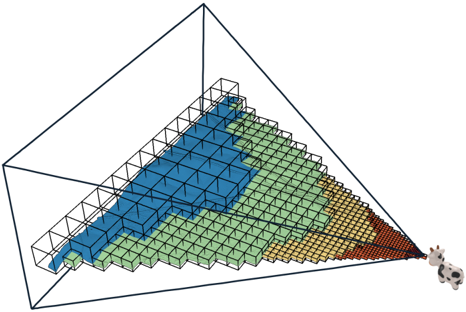
The image depicts a 3D geometric structure resembling a truncated pyramid or triangular prism, subdivided into color-coded regions. A stylized cow figure is tethered to the base of the structure, suggesting a connection between the animal and the spatial partitioning system. The grid is composed of intersecting black lines forming cubic cells, with color gradients transitioning from blue (top-left) to green, yellow, and brown (bottom-right).
### Components/Axes
- **Structure**:
- **Base**: Triangular footprint with a grid of cubic cells.
- **Apex**: Narrowed top section, partially obscured by the grid framework.
- **Color Zones**:
- **Blue**: Dominates the upper-left quadrant, covering ~40% of the grid.
- **Green**: Transitions from blue, occupying ~35% of the grid.
- **Yellow**: Smaller section (~15%) in the lower-middle region.
- **Brown**: Smallest zone (~10%) at the bottom-right, adjacent to the cow.
- **Cow Figure**: Positioned at the base’s bottom-right corner, tethered to the grid via a thin line.
### Detailed Analysis
- **Grid Composition**:
- The grid is a 3D lattice with visible depth, created by intersecting horizontal and vertical lines.
- Cells are uniformly sized, though color saturation varies slightly within zones (e.g., blue cells are darker at the top).
- **Color Distribution**:
- Blue and green zones form a contiguous block, while yellow and brown are isolated.
- No numerical labels or legends are present to quantify the color regions.
- **Cow Placement**:
- The cow is rendered in monochrome (white body, black spots) and faces the grid, implying interaction or dependency.
### Key Observations
1. **Color Gradient**: The transition from blue to brown suggests a hierarchical or categorical system, though no explicit key is provided.
2. **Cow’s Role**: The tethered cow may symbolize a resource, constraint, or external influence on the grid’s structure.
3. **Missing Labels**: No axis titles, legends, or textual annotations are visible, limiting quantitative interpretation.
### Interpretation
The diagram likely represents a spatial or resource allocation model, with color zones indicating priority, usage, or risk levels. The cow’s tethering could imply a dependency on the grid’s structure (e.g., grazing area, resource extraction). Without textual labels, the exact purpose remains ambiguous, but the visual hierarchy suggests a focus on the bottom-right (brown) zone as a critical or constrained area. The absence of legends or scales underscores the need for additional context to validate assumptions.