## Box Plot: Vocals vs. Instrumental Scores by Label
### Overview
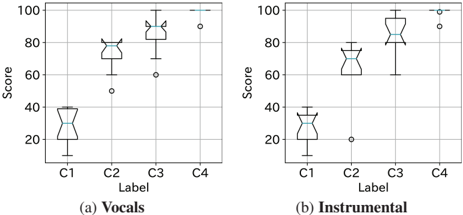
The image presents two box plots side-by-side, comparing scores for "Vocals" and "Instrumental" across four labels (C1, C2, C3, C4). Each box plot displays the distribution of scores for a given label, showing the median, quartiles, and outliers.
### Components/Axes
* **Y-axis (Score):** Ranges from 0 to 100, with tick marks at intervals of 20.
* **X-axis (Label):** Categorical axis with four labels: C1, C2, C3, and C4.
* **Box Plot Components:** Each box plot shows the median (horizontal line within the box), the first and third quartiles (edges of the box), and whiskers extending to the most extreme data point within 1.5 times the interquartile range. Outliers are plotted as individual points beyond the whiskers.
* **Titles:**
* (a) Vocals
* (b) Instrumental
### Detailed Analysis
**1. Vocals (Left Box Plot)**
* **C1:** The box plot for C1 shows a median score around 30. The box extends from approximately 20 to 40. The whiskers extend from approximately 10 to 40.
* **C2:** The box plot for C2 shows a median score around 75. The box extends from approximately 70 to 80. The whiskers extend from approximately 50 to 80. There is one outlier at approximately 50.
* **C3:** The box plot for C3 shows a median score around 90. The box extends from approximately 80 to 95. The whiskers extend from approximately 70 to 100. There is one outlier at approximately 60.
* **C4:** The box plot for C4 shows a median score around 100. The box extends from approximately 98 to 100. The whiskers extend from approximately 90 to 100. There is one outlier at approximately 90.
**2. Instrumental (Right Box Plot)**
* **C1:** The box plot for C1 shows a median score around 30. The box extends from approximately 20 to 40. The whiskers extend from approximately 10 to 40.
* **C2:** The box plot for C2 shows a median score around 70. The box extends from approximately 65 to 75. The whiskers extend from approximately 60 to 80.
* **C3:** The box plot for C3 shows a median score around 85. The box extends from approximately 80 to 95. The whiskers extend from approximately 60 to 100. There is one outlier at approximately 60.
* **C4:** The box plot for C4 shows a median score around 100. The box extends from approximately 98 to 100. The whiskers extend from approximately 90 to 100. There is one outlier at approximately 90.
### Key Observations
* Both "Vocals" and "Instrumental" show a general trend of increasing scores from C1 to C4.
* C1 has the lowest scores for both categories, while C4 has the highest.
* The distributions for C4 are very tight, with most scores clustered near 100.
* C2 and C3 show more variability in scores compared to C1 and C4.
* The median scores for C1 are nearly identical for both Vocals and Instrumental.
### Interpretation
The box plots suggest that the labels C1 to C4 represent some kind of ordered progression or increasing quality/performance. Both vocals and instrumental tracks show a similar pattern, with C4 consistently achieving the highest scores and C1 the lowest. The greater variability in scores for C2 and C3 might indicate more nuanced differences or inconsistencies within those categories. The outliers suggest occasional instances where the scores deviate significantly from the typical range for each label. The similarity between vocal and instrumental scores for C1 suggests that whatever factor C1 represents affects both aspects equally.