\n
## Box Plot: Score Distribution by Label and Category
### Overview
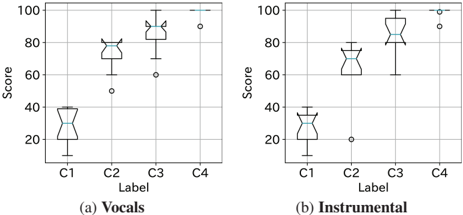
The image presents two box plots, side-by-side, comparing the distribution of "Score" values across four "Label" categories (C1, C2, C3, C4) for two different categories: "(a) Vocals" and "(b) Instrumental". Each box plot displays the median, quartiles, and outliers for each label within its respective category.
### Components/Axes
* **X-axis:** Labeled "Label", with markers C1, C2, C3, and C4.
* **Y-axis:** Labeled "Score", with a scale ranging from approximately 10 to 100.
* **Category 1:** "(a) Vocals" - Box plots representing score distributions for vocal data.
* **Category 2:** "(b) Instrumental" - Box plots representing score distributions for instrumental data.
* **Box Plot Components:** Each box plot shows the median (line inside the box), the interquartile range (IQR) represented by the box itself, and whiskers extending to the minimum and maximum values within 1.5 times the IQR. Outliers are represented as individual circles beyond the whiskers.
### Detailed Analysis or Content Details
**Vocals (a):**
* **C1:** The median score is approximately 30. The box extends from roughly 20 to 45. There are no outliers.
* **C2:** The median score is approximately 75. The box extends from roughly 65 to 85. There are two outliers at approximately 55 and 60.
* **C3:** The median score is approximately 85. The box extends from roughly 75 to 95. There is one outlier at approximately 90.
* **C4:** The median score is approximately 90. The box extends from roughly 80 to 95. There are no outliers.
**Instrumental (b):**
* **C1:** The median score is approximately 30. The box extends from roughly 20 to 40. There is one outlier at approximately 15.
* **C2:** The median score is approximately 70. The box extends from roughly 60 to 80. There are no outliers.
* **C3:** The median score is approximately 80. The box extends from roughly 70 to 90. There is one outlier at approximately 95.
* **C4:** The median score is approximately 85. The box extends from roughly 75 to 95. There are no outliers.
### Key Observations
* For both Vocals and Instrumental, scores generally increase from C1 to C4.
* C1 consistently has the lowest median score in both categories.
* C4 consistently has the highest median score in both categories.
* The Instrumental category tends to have fewer outliers than the Vocal category.
* The spread of scores (IQR) appears to be wider for C3 and C4 in both categories, indicating greater variability.
### Interpretation
The data suggests a positive correlation between the "Label" category (C1-C4) and the "Score" for both Vocal and Instrumental data. Higher labels (C3 and C4) consistently receive higher scores, indicating a potential ranking or progression in quality or preference. The differences in the spread of scores (IQR) between labels might indicate that some labels have more consistent results than others. The presence of outliers suggests that there are some instances where scores deviate significantly from the typical range for a given label. The difference in outlier frequency between Vocals and Instrumentals could indicate that vocal scores are more susceptible to extreme variations than instrumental scores. Further investigation would be needed to understand the meaning of the labels (C1-C4) and the context of the scores. The data could represent subjective evaluations of musical pieces or performances, where higher scores indicate greater artistic merit or technical skill.