## Chart: Performance Metrics vs. Draft Length for Different Models
### Overview
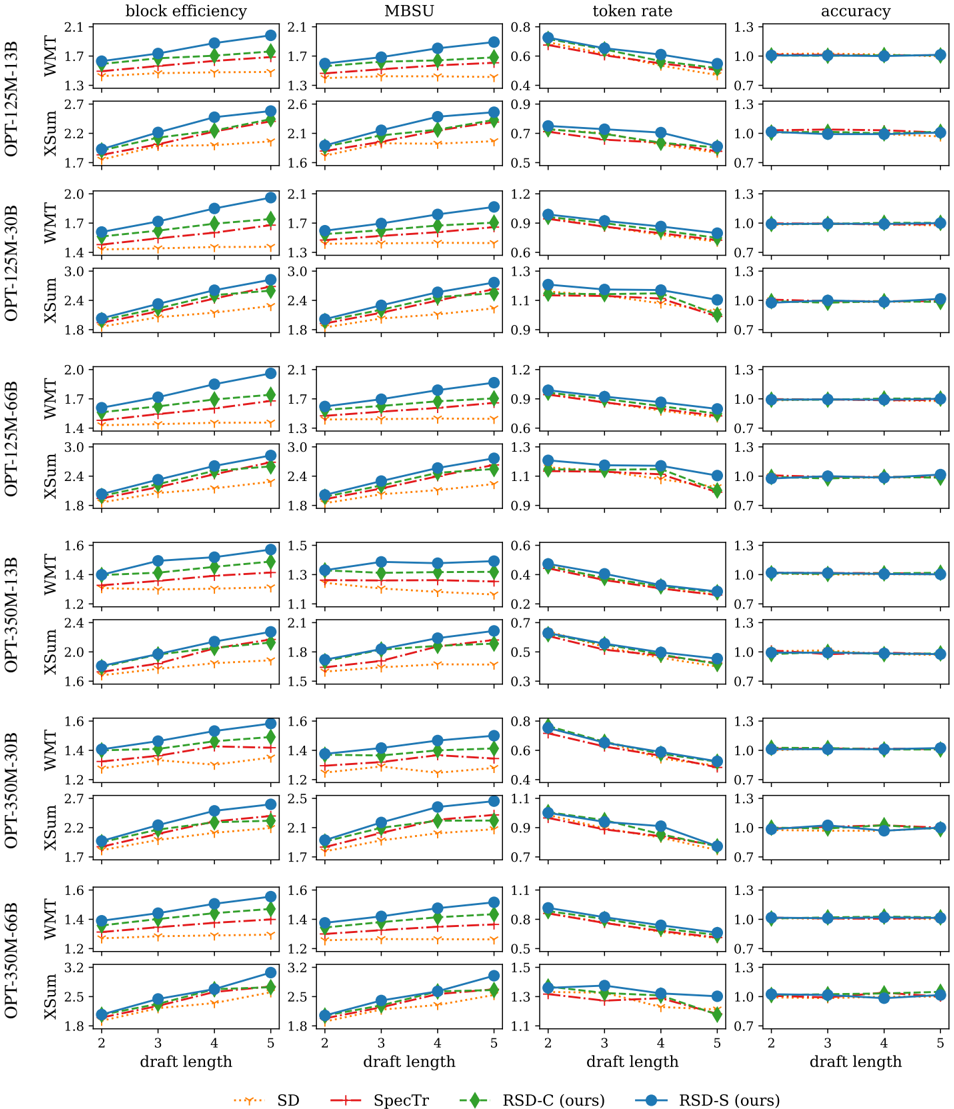
The image presents a series of line charts comparing the performance of different language models (OPT-125M-13B, OPT-125M-30B, OPT-125M-66B, OPT-350M-13B, OPT-350M-30B, OPT-350M-66B) on various metrics (block efficiency, MBSU, token rate, accuracy) across different draft lengths (2 to 5). The models are evaluated using four different methods: SD, SpecTr, RSD-C (ours), and RSD-S (ours).
### Components/Axes
* **Rows:** Each row represents a different model and dataset combination. The rows are labeled as follows:
* OPT-125M-13B WMT
* OPT-125M-13B XSum
* OPT-125M-30B WMT
* OPT-125M-30B XSum
* OPT-125M-66B WMT
* OPT-125M-66B XSum
* OPT-350M-13B WMT
* OPT-350M-13B XSum
* OPT-350M-30B WMT
* OPT-350M-30B XSum
* OPT-350M-66B WMT
* OPT-350M-66B XSum
* **Columns:** Each column represents a different performance metric. The columns are labeled as follows:
* block efficiency (Y-axis range: approximately 1.2 to 3.4)
* MBSU (Y-axis range: approximately 1.0 to 3.2)
* token rate (Y-axis range: approximately 0.2 to 1.2)
* accuracy (Y-axis range: approximately 0.7 to 1.3)
* **X-axis:** All charts share the same x-axis, labeled "draft length," with values ranging from 2 to 5.
* **Legend:** Located at the bottom of the image.
* SD (dotted orange line)
* SpecTr (red line with plus markers)
* RSD-C (ours) (green dashed line with diamond markers)
* RSD-S (ours) (solid blue line with circle markers)
### Detailed Analysis
**Block Efficiency:**
* **General Trend:** For most model/dataset combinations, block efficiency tends to increase with draft length.
* **RSD-S (ours):** Generally exhibits the highest block efficiency.
* **SD:** Generally exhibits the lowest block efficiency.
* **Specific Values (OPT-125M-13B WMT):**
* SD: Starts around 1.3 and increases to approximately 1.7.
* SpecTr: Starts around 1.7 and increases to approximately 2.0.
* RSD-C (ours): Starts around 1.7 and increases to approximately 2.0.
* RSD-S (ours): Starts around 1.7 and increases to approximately 2.1.
**MBSU:**
* **General Trend:** Similar to block efficiency, MBSU tends to increase with draft length.
* **RSD-S (ours):** Generally exhibits the highest MBSU.
* **SD:** Generally exhibits the lowest MBSU.
* **Specific Values (OPT-125M-13B WMT):**
* SD: Starts around 1.6 and increases to approximately 2.1.
* SpecTr: Starts around 1.7 and increases to approximately 2.0.
* RSD-C (ours): Starts around 1.7 and increases to approximately 2.0.
* RSD-S (ours): Starts around 1.7 and increases to approximately 2.1.
**Token Rate:**
* **General Trend:** Token rate tends to decrease with draft length.
* **SD:** Generally exhibits the lowest token rate.
* **RSD-S (ours):** Generally exhibits the highest token rate.
* **Specific Values (OPT-125M-13B WMT):**
* SD: Starts around 0.7 and decreases to approximately 0.5.
* SpecTr: Starts around 0.8 and decreases to approximately 0.7.
* RSD-C (ours): Starts around 0.7 and decreases to approximately 0.6.
* RSD-S (ours): Starts around 0.8 and decreases to approximately 0.7.
**Accuracy:**
* **General Trend:** Accuracy remains relatively constant across different draft lengths.
* **RSD-S (ours) and RSD-C (ours):** Generally exhibit the highest accuracy.
* **SD and SpecTr:** Generally exhibit the lowest accuracy.
* **Specific Values (OPT-125M-13B WMT):**
* SD: Remains constant at approximately 0.7.
* SpecTr: Remains constant at approximately 1.0.
* RSD-C (ours): Remains constant at approximately 1.0.
* RSD-S (ours): Remains constant at approximately 1.0.
### Key Observations
* RSD-S (ours) generally outperforms the other methods in terms of block efficiency, MBSU, and accuracy.
* SD generally performs the worst across all metrics.
* Token rate decreases with increasing draft length, while block efficiency and MBSU increase.
* Accuracy is relatively stable across different draft lengths.
* The performance differences between methods are more pronounced for block efficiency and MBSU than for accuracy.
### Interpretation
The data suggests that the RSD-S (ours) method is the most effective among the tested methods for improving the performance of language models, as it consistently achieves higher block efficiency, MBSU, and accuracy. The increase in block efficiency and MBSU with draft length indicates that longer drafts allow the models to generate more coherent and informative text. The decrease in token rate with draft length may be due to the models becoming more efficient at generating text as the draft length increases. The relatively constant accuracy across different draft lengths suggests that the models are able to maintain a consistent level of correctness regardless of the draft length. The poor performance of SD across all metrics highlights the importance of using more sophisticated methods for improving language model performance.