TECHNICAL ASSET FINGERPRINT
44a15c41494e06200460f9c5
Click to view fullscreen
Press ESC or click to close
FOUND IN PAPERS
EXPERT: healer-alpha-free VERSION 1
RUNTIME: free/openrouter/healer-alpha
INTEL_VERIFIED
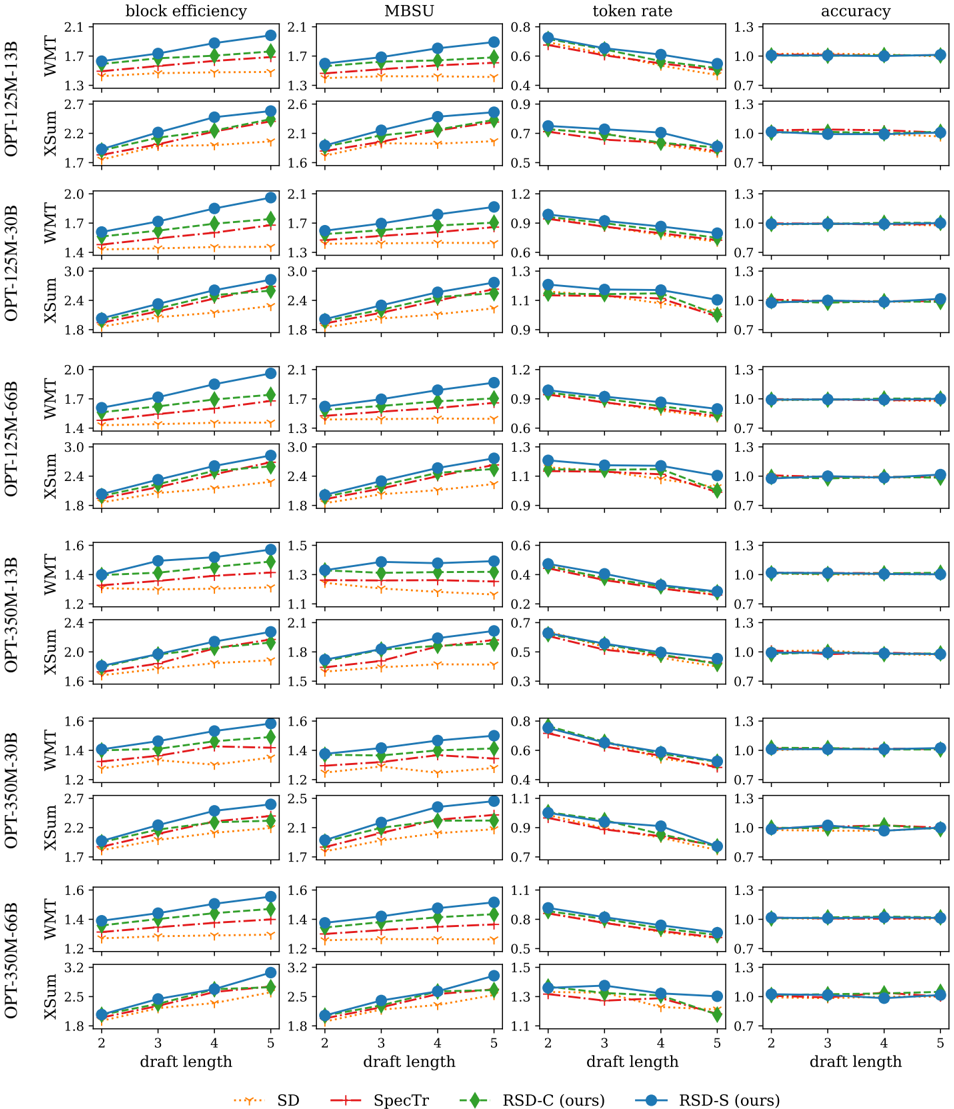
## Multi-Chart Performance Comparison: Speculative Decoding Methods
### Overview
The image is a grid of 32 line charts arranged in 8 rows and 4 columns. It presents a performance comparison of four speculative decoding methods across eight different language model configurations (four OPT model sizes, each tested on two datasets: WMT and XSum). The four performance metrics evaluated are block efficiency, MBSU, token rate, and accuracy. The charts plot each metric against "draft length" (values 2, 3, 4, 5).
### Components/Axes
* **Global Structure:** 8 rows (Model/Dataset combinations) x 4 columns (Metrics).
* **Row Labels (Left Side):** Each row is labeled with a model and dataset pair. The models are:
* OPT-125M-13B
* OPT-125M-30B
* OPT-125M-66B
* OPT-350M-13B
* OPT-350M-30B
* OPT-350M-66B
* (Note: The first two rows appear to be mislabeled as "OPT-125M-13B" and "OPT-125M-30B" but contain data for WMT and XSum respectively. The pattern suggests the first four rows are for the 125M model family, and the last four for the 350M family.)
* **Column Headers (Top):** The four metrics are:
1. **block efficiency** (Y-axis scale varies, ~1.2 to 3.2)
2. **MBSU** (Y-axis scale varies, ~1.1 to 3.0)
3. **token rate** (Y-axis scale varies, ~0.3 to 1.5)
4. **accuracy** (Y-axis scale is consistently 0.7 to 1.3)
* **X-Axis (Bottom):** Labeled "draft length" with tick marks at 2, 3, 4, and 5.
* **Legend (Bottom Center):** Defines the four methods being compared:
* `SD` (Orange, dotted line, 'x' marker)
* `SpecTr` (Red, dash-dot line, '+' marker)
* `RSD-C (ours)` (Green, dashed line, diamond marker)
* `RSD-S (ours)` (Blue, solid line, circle marker)
### Detailed Analysis
**Trend Verification & Data Point Extraction (Approximate Values):**
**General Trends Across All Charts:**
* **block efficiency & MBSU:** For nearly all model/dataset combinations, these metrics show a clear **upward trend** as draft length increases from 2 to 5. The blue line (RSD-S) is consistently the highest, followed by green (RSD-C), red (SpecTr), and orange (SD).
* **token rate:** Shows a clear **downward trend** as draft length increases. The order is typically inverted: SD (orange) often starts highest at draft length 2 but declines steeply. RSD-S (blue) and RSD-C (green) maintain higher rates at longer draft lengths.
* **accuracy:** All methods maintain accuracy very close to 1.0 (perfect accuracy) across all draft lengths. The lines are nearly flat and overlapping, indicating minimal impact on final output quality.
**Row-by-Row Analysis (Key Data Points at Draft Length 2 and 5):**
1. **OPT-125M-13B (WMT):**
* *Block Efficiency:* SD: ~1.4 -> 1.5; RSD-S: ~1.7 -> 2.1.
* *Token Rate:* SD: ~0.75 -> 0.55; RSD-S: ~0.75 -> 0.60.
2. **OPT-125M-13B (XSum):**
* *Block Efficiency:* SD: ~1.9 -> 2.2; RSD-S: ~2.2 -> 2.7.
* *MBSU:* SD: ~1.8 -> 2.0; RSD-S: ~2.1 -> 2.6.
3. **OPT-125M-30B (WMT):**
* *Block Efficiency:* SD: ~1.4 -> 1.5; RSD-S: ~1.6 -> 2.0.
* *Token Rate:* SD: ~1.0 -> 0.8; RSD-S: ~1.0 -> 0.9.
4. **OPT-125M-30B (XSum):**
* *Block Efficiency:* SD: ~2.0 -> 2.4; RSD-S: ~2.2 -> 2.9.
* *MBSU:* SD: ~2.0 -> 2.3; RSD-S: ~2.2 -> 2.8.
5. **OPT-125M-66B (WMT):**
* *Block Efficiency:* SD: ~1.4 -> 1.5; RSD-S: ~1.6 -> 2.0.
* *Token Rate:* SD: ~0.95 -> 0.75; RSD-S: ~0.95 -> 0.85.
6. **OPT-125M-66B (XSum):**
* *Block Efficiency:* SD: ~2.0 -> 2.4; RSD-S: ~2.3 -> 3.0.
* *MBSU:* SD: ~2.0 -> 2.3; RSD-S: ~2.3 -> 2.9.
7. **OPT-350M-13B (WMT):**
* *Block Efficiency:* SD: ~1.3 -> 1.4; RSD-S: ~1.4 -> 1.6.
* *Token Rate:* SD: ~0.45 -> 0.30; RSD-S: ~0.45 -> 0.35.
8. **OPT-350M-13B (XSum):**
* *Block Efficiency:* SD: ~1.7 -> 2.0; RSD-S: ~1.8 -> 2.2.
* *MBSU:* SD: ~1.6 -> 1.8; RSD-S: ~1.8 -> 2.1.
9. **OPT-350M-30B (WMT):**
* *Block Efficiency:* SD: ~1.3 -> 1.4; RSD-S: ~1.4 -> 1.6.
* *Token Rate:* SD: ~0.75 -> 0.55; RSD-S: ~0.75 -> 0.60.
10. **OPT-350M-30B (XSum):**
* *Block Efficiency:* SD: ~2.0 -> 2.3; RSD-S: ~2.2 -> 2.7.
* *MBSU:* SD: ~1.9 -> 2.2; RSD-S: ~2.1 -> 2.5.
11. **OPT-350M-66B (WMT):**
* *Block Efficiency:* SD: ~1.3 -> 1.4; RSD-S: ~1.4 -> 1.6.
* *Token Rate:* SD: ~0.85 -> 0.70; RSD-S: ~0.85 -> 0.75.
12. **OPT-350M-66B (XSum):**
* *Block Efficiency:* SD: ~2.2 -> 2.6; RSD-S: ~2.5 -> 3.2.
* *MBSU:* SD: ~2.2 -> 2.5; RSD-S: ~2.5 -> 3.0.
### Key Observations
1. **Consistent Hierarchy:** The performance order (RSD-S > RSD-C > SpecTr > SD) for block efficiency and MBSU is remarkably consistent across all 16 charts for these metrics.
2. **Metric Trade-off:** There is a clear trade-off between **block efficiency/MBSU** (which improve with longer drafts) and **token rate** (which degrades with longer drafts). The proposed RSD methods (especially RSD-S) achieve a better balance, maintaining higher token rates at longer drafts compared to baselines.
3. **Accuracy Preservation:** All methods, including the baselines, maintain near-perfect accuracy (~1.0), indicating that the gains in efficiency from speculative decoding do not come at the cost of output quality for these tasks.
4. **Model Size Effect:** The absolute values for block efficiency and MBSU are generally higher for the XSum dataset compared to WMT within the same model family. The trends, however, are identical.
5. **RSD-S Dominance:** The blue line (RSD-S) is not only the highest but also often shows the steepest positive slope for efficiency metrics, indicating it benefits the most from increased draft length.
### Interpretation
This data strongly suggests that the authors' proposed methods, **RSD-C and RSD-S, are superior speculative decoding techniques** compared to the SD and SpecTr baselines. The core finding is that RSD methods achieve a more favorable trade-off: they significantly increase the number of tokens generated per decoding block (block efficiency) and the model-based speculative utility (MBSU) as the draft length grows, without suffering a proportional drop in the overall token generation rate. Crucially, this is accomplished while preserving perfect output accuracy.
The consistent performance across different model scales (125M to 66B parameters) and different tasks (WMT translation, XSum summarization) indicates the robustness of the advantage. The charts tell a story of optimization: RSD-S, in particular, appears to be the most effective method for maximizing the throughput of speculative decoding systems, especially when longer draft sequences are feasible. The investigation reveals that the key innovation likely lies in how RSD methods select or verify draft tokens, allowing them to reap greater efficiency benefits from longer speculation horizons.
DECODING INTELLIGENCE...