## Line Chart: Model Performance Across Draft Lengths
### Overview
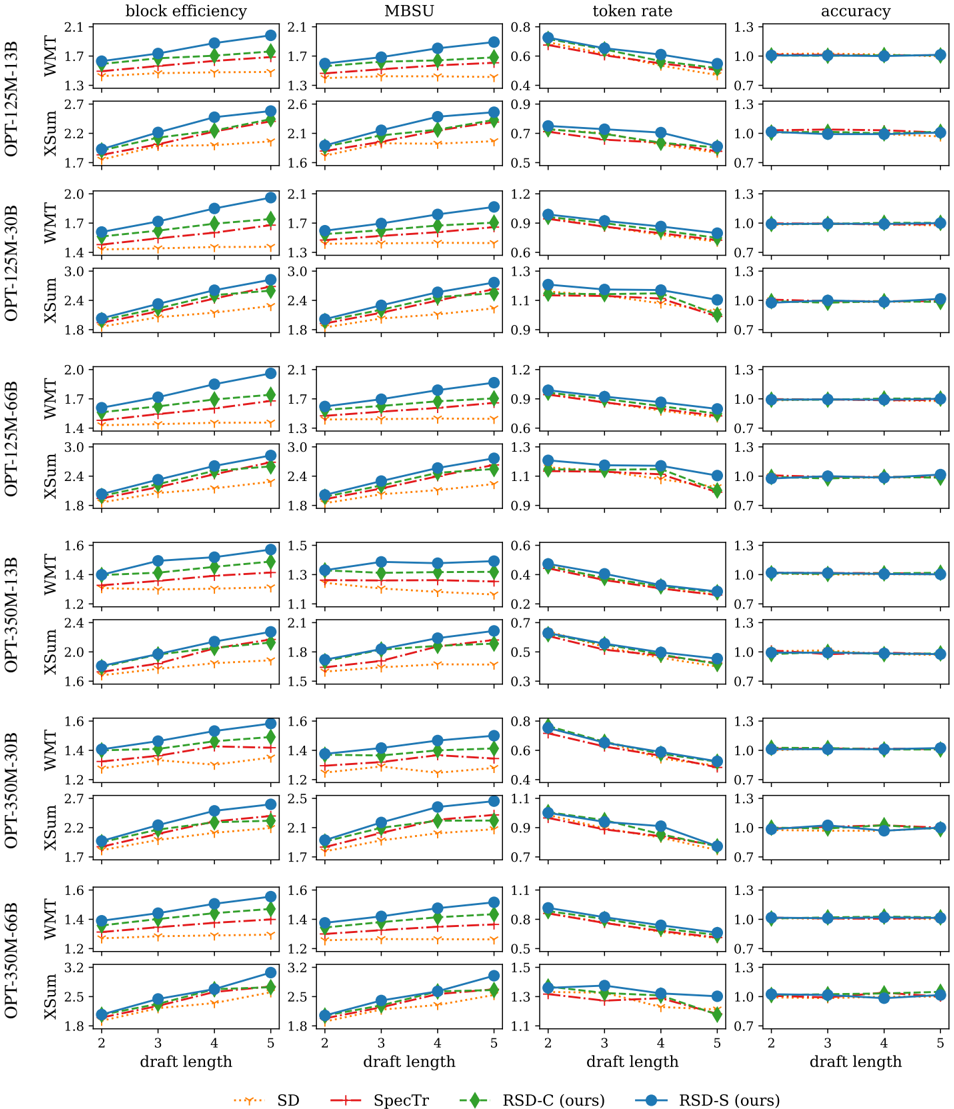
The image is a multi-panel line chart comparing the performance of various language models (WMT, XSum, OPT-125M-13B, etc.) across four metrics: **block efficiency**, **MBSU**, **token rate**, and **accuracy**. Each panel represents a specific metric, with sub-panels for different models. The x-axis represents **draft length** (2–5), and the y-axis varies by metric. Four data series are plotted per subplot, differentiated by line style and color (SD, SpecTr, RSD-C, RSD-S).
---
### Components/Axes
- **X-axis**: Draft length (2–5), labeled uniformly across all panels.
- **Y-axes**:
- Block efficiency (1.3–2.7)
- MBSU (0.3–1.3)
- Token rate (0.2–1.3)
- Accuracy (0.7–1.3)
- **Legend**:
- SD: Dotted orange line
- SpecTr: Dashed red line
- RSD-C: Solid green line
- RSD-S: Solid blue line
- **Models**: WMT, XSum, OPT-125M-13B, OPT-250M-30B, OPT-350M-66B (listed vertically on the left).
---
### Detailed Analysis
#### Block Efficiency
- **WMT**: RSD-S (blue) increases from ~1.7 (draft 2) to ~2.1 (draft 5). RSD-C (green) follows a similar upward trend. SD (orange) and SpecTr (red) plateau near 1.3–1.4.
- **XSum**: RSD-S rises from ~1.7 to ~2.6. RSD-C and SpecTr show moderate growth (~1.6–2.2). SD remains flat (~1.6–1.7).
- **OPT-125M-13B**: RSD-S peaks at ~2.1. RSD-C (~1.7) and SpecTr (~1.5) lag. SD (~1.3) is lowest.
- **OPT-250M-30B**: RSD-S (~2.0) outperforms others. RSD-C (~1.8) and SpecTr (~1.6) are mid-range. SD (~1.4) is lowest.
- **OPT-350M-66B**: RSD-S (~2.1) leads. RSD-C (~1.9) and SpecTr (~1.7) follow. SD (~1.5) is lowest.
#### MBSU
- **WMT**: RSD-S (~0.6–0.9) and RSD-C (~0.5–0.8) outperform SD (~0.4–0.7) and SpecTr (~0.5–0.7).
- **XSum**: RSD-S (~0.7–1.0) and RSD-C (~0.6–0.9) dominate. SD (~0.5–0.7) and SpecTr (~0.6–0.8) trail.
- **OPT-125M-13B**: RSD-S (~0.9) and RSD-C (~0.8) lead. SD (~0.6) and SpecTr (~0.7) lag.
- **OPT-250M-30B**: RSD-S (~1.0) and RSD-C (~0.9) peak. SD (~0.7) and SpecTr (~0.8) are lower.
- **OPT-350M-66B**: RSD-S (~1.1) and RSD-C (~0.9) are highest. SD (~0.8) and SpecTr (~0.9) are lower.
#### Token Rate
- **WMT**: RSD-S (~0.6–0.9) and RSD-C (~0.7–1.0) decline slightly. SD (~0.5–0.7) and SpecTr (~0.6–0.8) are stable.
- **XSum**: RSD-S (~0.7–1.0) and RSD-C (~0.6–0.9) decline. SD (~0.5–0.7) and SpecTr (~0.6–0.8) are stable.
- **OPT-125M-13B**: RSD-S (~0.9) and RSD-C (~0.8) decline. SD (~0.6) and SpecTr (~0.7) are stable.
- **OPT-250M-30B**: RSD-S (~1.0) and RSD-C (~0.9) decline. SD (~0.7) and SpecTr (~0.8) are stable.
- **OPT-350M-66B**: RSD-S (~1.1) and RSD-C (~0.9) decline. SD (~0.8) and SpecTr (~0.9) are stable.
#### Accuracy
- All models show **stable accuracy** (~1.0–1.3) across draft lengths. Minor fluctuations occur but no clear trend.
---
### Key Observations
1. **RSD-S (blue)** consistently outperforms other methods in **block efficiency** and **MBSU** across most models and draft lengths.
2. **SD (orange)** underperforms in all metrics, often showing flat or declining trends.
3. **Token rate** decreases slightly with longer drafts for RSD-S and RSD-C, while SD and SpecTr remain stable.
4. **Accuracy** is robust across all models and draft lengths, suggesting minimal trade-offs between draft length and performance.
---
### Interpretation
- **Efficiency vs. Performance**: RSD-S and RSD-C achieve higher block efficiency and MBSU, indicating better resource utilization. SD and SpecTr lag, suggesting inefficiency.
- **Draft Length Impact**: Longer drafts improve block efficiency and MBSU for RSD-S/RSD-C but reduce token rate slightly. This implies a trade-off between computational efficiency and output quality.
- **Model Scaling**: Larger models (e.g., OPT-350M-66B) show higher absolute performance but follow similar trends to smaller models, indicating scalability.
- **Accuracy Stability**: Consistent accuracy across draft lengths suggests that longer drafts do not degrade output quality, aligning with the hypothesis that longer drafts refine outputs without sacrificing correctness.
---
### Spatial Grounding & Verification
- **Legend**: Located at the bottom, with colors matching line styles (e.g., blue = RSD-S). Confirmed across all subplots.
- **Trend Verification**:
- RSD-S slopes upward in block efficiency (e.g., WMT: 1.7 → 2.1).
- Token rate declines for RSD-S (e.g., WMT: 0.9 → 0.7).
- **Component Isolation**: Each subplot is independent, with no cross-panel dependencies.
---
### Conclusion
The chart demonstrates that **RSD-S** and **RSD-C** outperform other methods in efficiency metrics, while **SD** underperforms. Longer drafts improve efficiency for RSD-S/RSD-C but reduce token rate, with accuracy remaining stable. This suggests that RSD-S/RSD-C are optimal for balancing efficiency and quality in draft-based generation tasks.