## Diagram: Path Planning and State Transition
### Overview
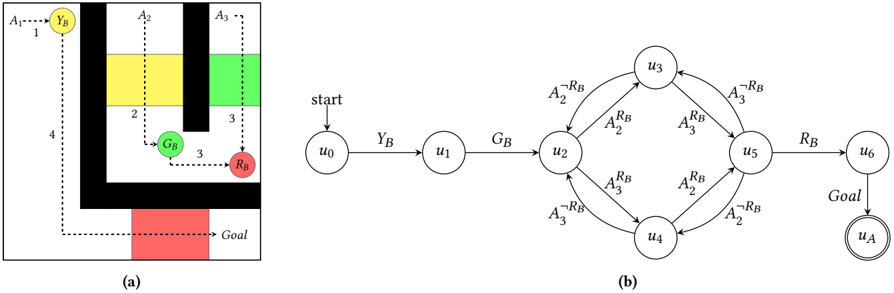
The image presents two diagrams side-by-side, labeled (a) and (b). Diagram (a) depicts a path planning scenario in a grid-like environment with colored regions and a goal. Diagram (b) shows a state transition diagram representing the possible states and transitions within the path planning problem.
### Components/Axes
**Diagram (a): Path Planning Environment**
* **Environment:** A grid-like environment with black walls.
* **Colored Regions:** Yellow (YB), Green (GB), and Red (RB) regions.
* **Goal:** A red region labeled "Goal" at the bottom.
* **Agent:** Represented by circles labeled YB, GB, and RB.
* **Path:** A dashed line indicating the path from the starting point (A1) to the goal.
* **Actions:** Labeled as A1, A2, and A3.
* **Step Numbers:** Numbers 1, 2, 3, and 4 indicating the sequence of steps.
**Diagram (b): State Transition Diagram**
* **States:** Represented by circles labeled u0, u1, u2, u3, u4, u5, u6, and uA.
* **Start State:** u0, indicated by an arrow labeled "start".
* **Goal State:** uA, indicated by a double circle and labeled "Goal".
* **Transitions:** Represented by arrows between states, labeled with actions and conditions (e.g., YB, GB, RB, A2^¬RB, A2^RB, A3^¬RB, A3^RB).
### Detailed Analysis
**Diagram (a): Path Planning Environment**
1. **Starting Point:** The agent starts at the top-left corner, labeled A1, and is initially in the "YB" (Yellow) state.
2. **Path Sequence:**
* Step 1: The agent moves from A1 to the yellow region (YB).
* Step 2: The agent moves from the yellow region to the green region (GB) using action A2.
* Step 3: The agent moves from the green region to the red region (RB) using action A3.
* Step 3: The agent moves from the red region to the red "Goal" region using action A3.
* Step 4: The agent moves from the top-left corner down to the bottom-left corner.
3. **Obstacles:** Black regions represent obstacles that the agent must avoid.
**Diagram (b): State Transition Diagram**
1. **Initial State:** The agent starts at state u0.
2. **Transitions:**
* u0 -> u1: Transition labeled "YB".
* u1 -> u2: Transition labeled "GB".
* u2 -> u3: Transition labeled "A2^¬RB" (Action A2, not in RB region).
* u2 -> u4: Transition labeled "A3^¬RB" (Action A3, not in RB region).
* u3 -> u5: Transition labeled "A3^RB" (Action A3, in RB region).
* u4 -> u5: Transition labeled "A2^RB" (Action A2, in RB region).
* u5 -> u3: Transition labeled "A3^¬RB" (Action A3, not in RB region).
* u5 -> u4: Transition labeled "A2^¬RB" (Action A2, not in RB region).
* u5 -> u6: Transition labeled "RB".
* u6 -> uA: Transition labeled "Goal".
3. **Goal State:** The agent reaches the goal state uA from state u6.
### Key Observations
* Diagram (a) provides a visual representation of the path planning problem, while diagram (b) formalizes the problem as a state transition diagram.
* The actions A1, A2, and A3 in diagram (a) correspond to transitions in diagram (b), with additional conditions based on the agent's location (e.g., RB).
* The state transition diagram shows the possible sequences of actions and states that lead to the goal.
### Interpretation
The image illustrates the relationship between a path planning problem and its corresponding state transition diagram. Diagram (a) provides a concrete example of the environment and the agent's path, while diagram (b) abstracts the problem into a set of states and transitions. The state transition diagram can be used to formally analyze the problem and design algorithms for finding the optimal path to the goal. The conditions on the transitions (e.g., A2^¬RB) indicate that the agent's actions may depend on its current location or state.