## Diagram: Robot Navigation and State Transition
### Overview
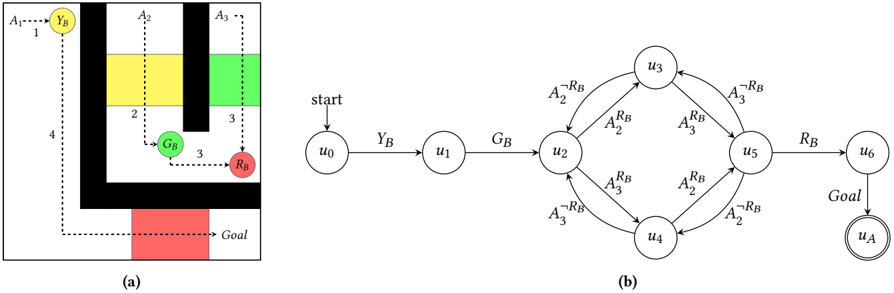
The image presents two related diagrams: (a) a grid-world representation of a robot's environment and path, and (b) a state transition diagram representing the robot's navigation logic. The grid-world shows a robot navigating from a starting point to a goal, while the state transition diagram illustrates the sequence of states and actions the robot takes to achieve this.
### Components/Axes
**(a) Grid-World:**
* **Axes:** Implicitly, a 2D grid with horizontal (x) and vertical (y) axes. The axes are not explicitly labeled with numerical values, but are represented by the grid structure.
* **Grid Cells:** Colored cells representing different areas: Yellow, Green, Red, and Black.
* **Robot Positions:** Marked by colored circles: Yellow (YB), Green (GB), and Red (RB).
* **Path:** A dotted line indicating the robot's trajectory.
* **Labels:** A1, A2, A3 (vertical columns), 1, 2, 3, 4 (horizontal rows), Goal.
**(b) State Transition Diagram:**
* **Nodes:** Circles representing states: u0 (start), u1, u2, u3, u4, u5, u6 (Goal).
* **Edges:** Arrows representing transitions between states, labeled with actions and conditions: YB, GB, A2RB, A3RB, A2RB, A3RB, RB, uA.
* **Labels:** Start, Goal.
### Detailed Analysis or Content Details
**(a) Grid-World:**
* The grid is 4 rows x 3 columns.
* The robot starts at position (1,1) represented by a yellow circle labeled YB.
* The robot moves to position (2,1) represented by a green circle labeled GB.
* The robot then moves to position (3,1) represented by a red circle labeled RB.
* The robot then moves towards the Goal, which is located in the bottom-right corner of the grid.
* The path is a dotted line from YB -> GB -> RB -> Goal.
* The grid is partitioned into regions:
* Column 1: Yellow (top), Yellow (middle), Red (bottom)
* Column 2: Black
* Column 3: Green
**(b) State Transition Diagram:**
* **u0 -> u1:** Transition labeled "YB".
* **u1 -> u2:** Transition labeled "GB".
* **u2 -> u3:** Transition labeled "A2RB".
* **u2 -> u4:** Transition labeled "A3RB".
* **u3 -> u5:** Transition labeled "A3RB".
* **u3 -> u4:** Transition labeled "A2RB".
* **u4 -> u5:** Transition labeled "A2RB".
* **u4 -> u3:** Transition labeled "A3RB".
* **u5 -> u6:** Transition labeled "RB".
* **u6 -> Goal:** Transition labeled "uA".
### Key Observations
* The grid-world represents a simplified environment with obstacles (black region).
* The robot's path avoids the black obstacle.
* The state transition diagram provides a formal representation of the robot's decision-making process.
* The actions (YB, GB, RB, A2RB, A3RB, uA) correspond to the robot's movements and interactions with the environment.
* The state transition diagram shows that the robot can reach the goal state (u6) from the start state (u0) by following a specific sequence of actions.
### Interpretation
The diagrams illustrate a robot navigation problem. The grid-world provides a visual representation of the environment and the robot's path, while the state transition diagram formalizes the robot's control logic. The robot navigates from a starting point to a goal, avoiding obstacles, by transitioning through a series of states based on its actions and the environment's conditions. The actions A2RB and A3RB likely represent actions related to navigating around obstacles in columns 2 and 3 respectively. The labels YB, GB, and RB likely represent the robot's position in the grid-world, triggering specific transitions in the state machine. The diagram suggests a reactive control strategy where the robot's actions are determined by its current state and the perceived environment. The use of a state transition diagram indicates a formal approach to robot control, potentially enabling verification and optimization of the navigation strategy.