## Line Chart: Accuracy and Purity by Layer
### Overview
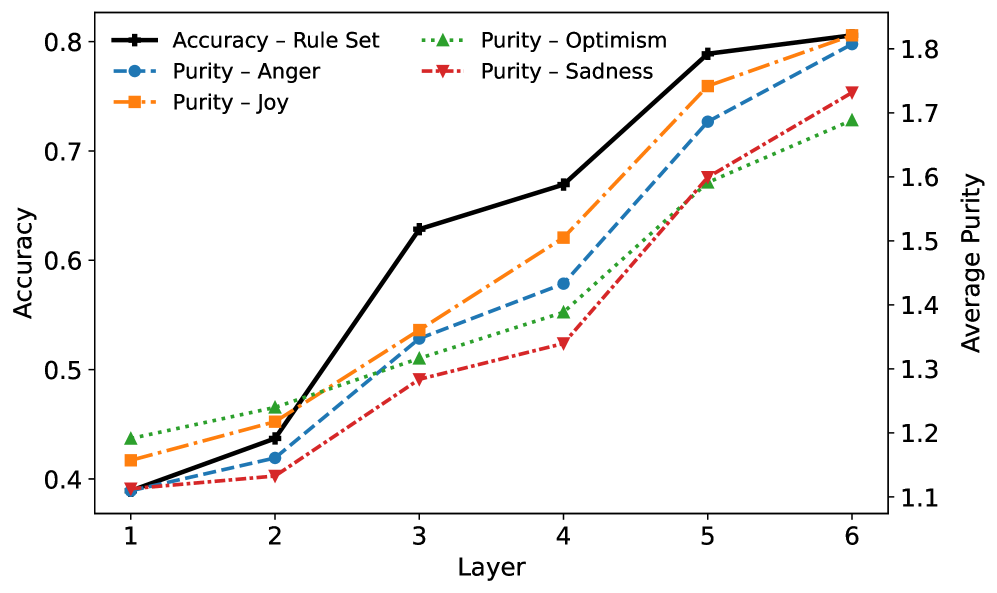
The image is a line chart comparing the accuracy of a "Rule Set" with the purity of four emotions (Anger, Joy, Optimism, and Sadness) across six layers. The x-axis represents the layer number (1 to 6). The left y-axis represents "Accuracy," ranging from 0.4 to 0.8. The right y-axis represents "Average Purity," ranging from 1.1 to 1.8.
### Components/Axes
* **X-axis:** "Layer" with values 1, 2, 3, 4, 5, and 6.
* **Left Y-axis:** "Accuracy" ranging from 0.4 to 0.8 in increments of 0.1.
* **Right Y-axis:** "Average Purity" ranging from 1.1 to 1.8 in increments of 0.1.
* **Legend:** Located at the top of the chart, it identifies the lines:
* Black solid line with square markers: "Accuracy - Rule Set"
* Blue dashed line with circle markers: "Purity - Anger"
* Orange dash-dot line with square markers: "Purity - Joy"
* Green dotted line with triangle markers: "Purity - Optimism"
* Red dash-dot-dot line with inverted triangle markers: "Purity - Sadness"
### Detailed Analysis
**1. Accuracy - Rule Set (Black solid line with square markers):**
The accuracy generally increases with each layer.
* Layer 1: ~0.39
* Layer 2: ~0.45
* Layer 3: ~0.63
* Layer 4: ~0.66
* Layer 5: ~0.78
* Layer 6: ~0.80
**2. Purity - Anger (Blue dashed line with circle markers):**
The purity of anger increases with each layer.
* Layer 1: ~1.12 (0.39 on left axis)
* Layer 2: ~1.15 (0.42 on left axis)
* Layer 3: ~1.35 (0.52 on left axis)
* Layer 4: ~1.50 (0.59 on left axis)
* Layer 5: ~1.72 (0.74 on left axis)
* Layer 6: ~1.78 (0.80 on left axis)
**3. Purity - Joy (Orange dash-dot line with square markers):**
The purity of joy increases with each layer.
* Layer 1: ~1.14 (0.41 on left axis)
* Layer 2: ~1.25 (0.47 on left axis)
* Layer 3: ~1.38 (0.54 on left axis)
* Layer 4: ~1.55 (0.63 on left axis)
* Layer 5: ~1.75 (0.77 on left axis)
* Layer 6: ~1.81 (0.81 on left axis)
**4. Purity - Optimism (Green dotted line with triangle markers):**
The purity of optimism increases with each layer.
* Layer 1: ~1.18 (0.44 on left axis)
* Layer 2: ~1.23 (0.46 on left axis)
* Layer 3: ~1.36 (0.53 on left axis)
* Layer 4: ~1.50 (0.59 on left axis)
* Layer 5: ~1.65 (0.69 on left axis)
* Layer 6: ~1.74 (0.76 on left axis)
**5. Purity - Sadness (Red dash-dot-dot line with inverted triangle markers):**
The purity of sadness increases with each layer.
* Layer 1: ~1.12 (0.39 on left axis)
* Layer 2: ~1.14 (0.41 on left axis)
* Layer 3: ~1.28 (0.50 on left axis)
* Layer 4: ~1.35 (0.53 on left axis)
* Layer 5: ~1.60 (0.67 on left axis)
* Layer 6: ~1.72 (0.75 on left axis)
### Key Observations
* The accuracy of the "Rule Set" is lower than the purity of all emotions at Layer 1 and Layer 2, but surpasses them significantly by Layer 6.
* The purity of "Joy" is consistently the highest among the four emotions across all layers.
* The purity of "Sadness" is consistently the lowest among the four emotions across all layers.
* All data series show an increasing trend as the layer number increases.
### Interpretation
The chart suggests that as the layers increase, both the accuracy of the "Rule Set" and the purity of the emotions improve. The "Rule Set" starts with lower accuracy but shows a steeper increase, eventually outperforming the purity of the individual emotions. This could indicate that the model becomes more accurate in its predictions as it processes through more layers. The relative purity levels of the emotions might reflect the inherent complexity or distinctiveness of each emotion within the dataset. "Joy" being the purest could mean it's the most easily identifiable emotion, while "Sadness" being the least pure could indicate it's more nuanced or easily confused with other emotions. The increasing trends across all data series suggest that the model benefits from deeper processing, regardless of whether it's measuring accuracy or emotional purity.