## Line Chart: Performance Metrics vs. Layer
### Overview
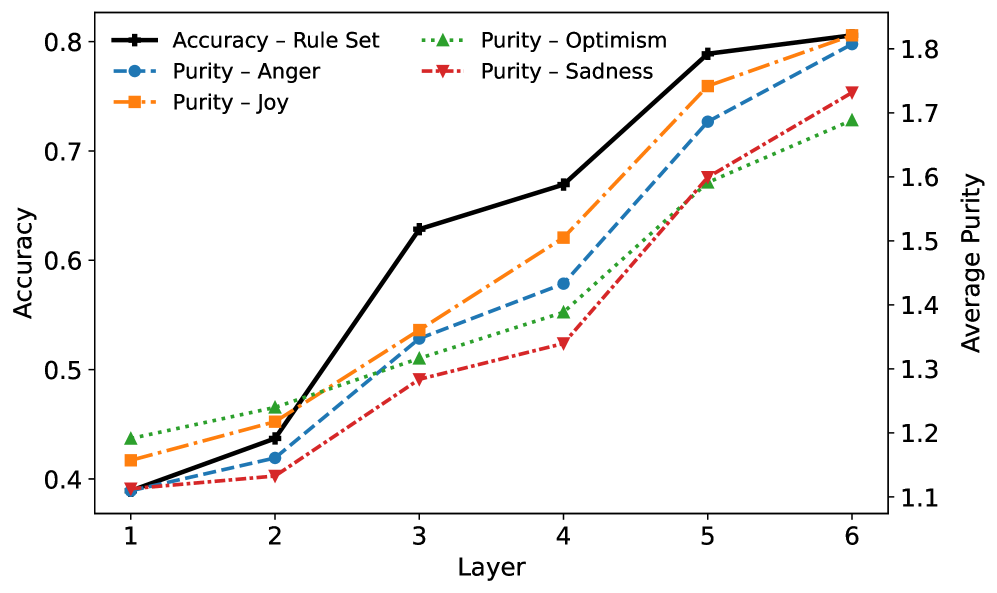
This line chart depicts the relationship between model layer and two performance metrics: Accuracy and Purity, for different emotional categories. The chart displays how these metrics change as the model progresses through layers 1 to 6. Accuracy is plotted on the primary y-axis (left), while Purity is plotted on the secondary y-axis (right).
### Components/Axes
* **X-axis:** Layer (ranging from 1 to 6).
* **Primary Y-axis (left):** Accuracy (ranging from 0.3 to 0.8).
* **Secondary Y-axis (right):** Average Purity (ranging from 1.1 to 1.9).
* **Legend:** Located in the top-right corner of the chart. Contains the following data series:
* Accuracy - Rule Set (Solid Black Line)
* Purity - Anger (Dashed Blue Line)
* Purity - Joy (Solid Orange Line)
* Purity - Optimism (Dashed Green Line)
* Purity - Sadness (Dashed Red Line)
### Detailed Analysis
Here's a breakdown of each data series and their trends:
* **Accuracy - Rule Set (Black Line):** This line shows a strong upward trend.
* Layer 1: Approximately 0.38
* Layer 2: Approximately 0.42
* Layer 3: Approximately 0.65
* Layer 4: Approximately 0.72
* Layer 5: Approximately 0.77
* Layer 6: Approximately 0.79
* **Purity - Anger (Blue Line):** This line exhibits an increasing trend, but less steep than the Accuracy line.
* Layer 1: Approximately 1.22
* Layer 2: Approximately 1.28
* Layer 3: Approximately 1.42
* Layer 4: Approximately 1.50
* Layer 5: Approximately 1.62
* Layer 6: Approximately 1.72
* **Purity - Joy (Orange Line):** This line shows a consistent upward trend, starting lower than Purity - Anger but eventually surpassing it.
* Layer 1: Approximately 1.18
* Layer 2: Approximately 1.25
* Layer 3: Approximately 1.45
* Layer 4: Approximately 1.60
* Layer 5: Approximately 1.73
* Layer 6: Approximately 1.82
* **Purity - Optimism (Green Line):** This line starts with the lowest purity value and increases steadily.
* Layer 1: Approximately 1.15
* Layer 2: Approximately 1.22
* Layer 3: Approximately 1.35
* Layer 4: Approximately 1.42
* Layer 5: Approximately 1.52
* Layer 6: Approximately 1.60
* **Purity - Sadness (Red Line):** This line shows a moderate upward trend, similar to Purity - Anger.
* Layer 1: Approximately 1.20
* Layer 2: Approximately 1.27
* Layer 3: Approximately 1.40
* Layer 4: Approximately 1.50
* Layer 5: Approximately 1.60
* Layer 6: Approximately 1.70
### Key Observations
* Accuracy consistently increases with each layer, suggesting the model's performance improves as it deepens.
* Purity values vary across emotional categories. Joy consistently has the highest purity, while Optimism starts with the lowest.
* The gap between Accuracy and Purity widens as the layer number increases.
* The most significant jump in Accuracy occurs between layers 2 and 3.
### Interpretation
The chart demonstrates the impact of model depth (layers) on both its overall accuracy and its ability to maintain purity across different emotional categories. The increasing accuracy suggests that deeper layers allow the model to learn more complex patterns and improve its predictive capabilities. The varying purity levels indicate that the model may be more sensitive to certain emotions than others. The fact that Joy consistently exhibits the highest purity could suggest that the model finds it easier to correctly classify instances of joy, or that the training data for joy is more balanced. The widening gap between accuracy and purity suggests that while the model becomes more accurate overall, it may also become more prone to misclassifications within specific emotional categories. This could be due to imbalances in the training data or inherent difficulties in distinguishing between certain emotions. The large jump in accuracy between layers 2 and 3 could indicate a critical point in the model's learning process, where it begins to effectively capture more nuanced features.