## Scatter Plot: DNN Performance Over Time
### Overview
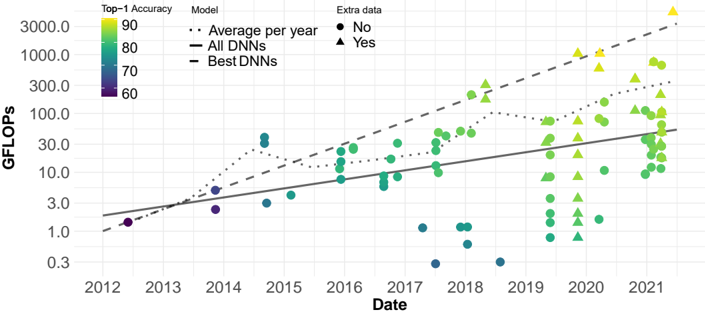
The image is a scatter plot showing the performance of Deep Neural Networks (DNNs) over time, measured in GFLOPS (Giga Floating Point Operations Per Second). The plot visualizes the relationship between date (from 2012 to 2021), performance, and Top-1 Accuracy, with additional data points indicating whether extra data was used.
### Components/Axes
* **X-axis:** Date, ranging from 2012 to 2021 in yearly increments.
* **Y-axis:** GFLOPS (Giga Floating Point Operations Per Second), ranging from 0.3 to 3000.0 on a logarithmic scale.
* **Color Legend (Top-1 Accuracy):**
* 90: Yellow
* 80: Light Green
* 70: Dark Green/Teal
* 60: Purple
* **Model Legend:**
* Average per year: Dotted line
* All DNNs: Solid line
* Best DNNs: Dashed line
* **Extra Data Legend:**
* No: Circle marker
* Yes: Triangle marker
### Detailed Analysis
* **Data Points:** Each data point represents a DNN model. The color of the point indicates its Top-1 Accuracy, and the shape indicates whether extra data was used.
* **Average per year (Dotted Line):** This line shows the average GFLOPS for each year. It starts at approximately 1 GFLOPS in 2012 and increases to approximately 300 GFLOPS in 2021.
* 2012: ~1 GFLOPS, Accuracy ~60
* 2014: ~4 GFLOPS, Accuracy ~60
* 2015: ~30 GFLOPS, Accuracy ~70
* 2016: ~15 GFLOPS, Accuracy ~70
* 2017: ~20 GFLOPS, Accuracy ~70
* 2018: ~40 GFLOPS, Accuracy ~70
* 2019: ~50 GFLOPS, Accuracy ~70
* 2020: ~100 GFLOPS, Accuracy ~80
* 2021: ~300 GFLOPS, Accuracy ~80
* **All DNNs (Solid Line):** This line represents the trend of all DNNs. It starts at approximately 1 GFLOPS in 2012 and increases to approximately 60 GFLOPS in 2021.
* 2012: ~1 GFLOPS, Accuracy ~60
* 2014: ~2 GFLOPS, Accuracy ~60
* 2016: ~4 GFLOPS, Accuracy ~70
* 2018: ~10 GFLOPS, Accuracy ~70
* 2020: ~30 GFLOPS, Accuracy ~80
* 2021: ~60 GFLOPS, Accuracy ~80
* **Best DNNs (Dashed Line):** This line represents the trend of the best-performing DNNs. It starts at approximately 1 GFLOPS in 2012 and increases to approximately 1000 GFLOPS in 2021.
* 2012: ~1 GFLOPS, Accuracy ~60
* 2014: ~3 GFLOPS, Accuracy ~60
* 2016: ~10 GFLOPS, Accuracy ~70
* 2018: ~50 GFLOPS, Accuracy ~70
* 2020: ~300 GFLOPS, Accuracy ~80
* 2021: ~1000 GFLOPS, Accuracy ~90
* **Extra Data:** The use of extra data (triangle markers) appears more frequently in later years (2019-2021) and is associated with higher GFLOPS and Top-1 Accuracy.
### Key Observations
* There is a clear upward trend in GFLOPS over time for all three model types (Average, All DNNs, Best DNNs).
* The "Best DNNs" consistently outperform "All DNNs" and the "Average per year."
* Higher Top-1 Accuracy (yellow/green) is generally associated with higher GFLOPS and later years.
* The use of extra data seems to correlate with higher performance and accuracy.
* The spread of data points increases over time, indicating a wider range of DNN performance.
### Interpretation
The data suggests a significant improvement in DNN performance (GFLOPS) and accuracy over the period from 2012 to 2021. The "Best DNNs" show the most dramatic increase, indicating advancements in model architecture or training techniques. The correlation between the use of extra data and higher performance suggests that data augmentation or larger datasets contribute to better results. The increasing spread of data points in later years could indicate a diversification of DNN applications and architectures, leading to a wider range of performance levels. Overall, the plot demonstrates the rapid progress in the field of deep learning over the past decade.