\n
## Image Analysis: Rendering Comparison
### Overview
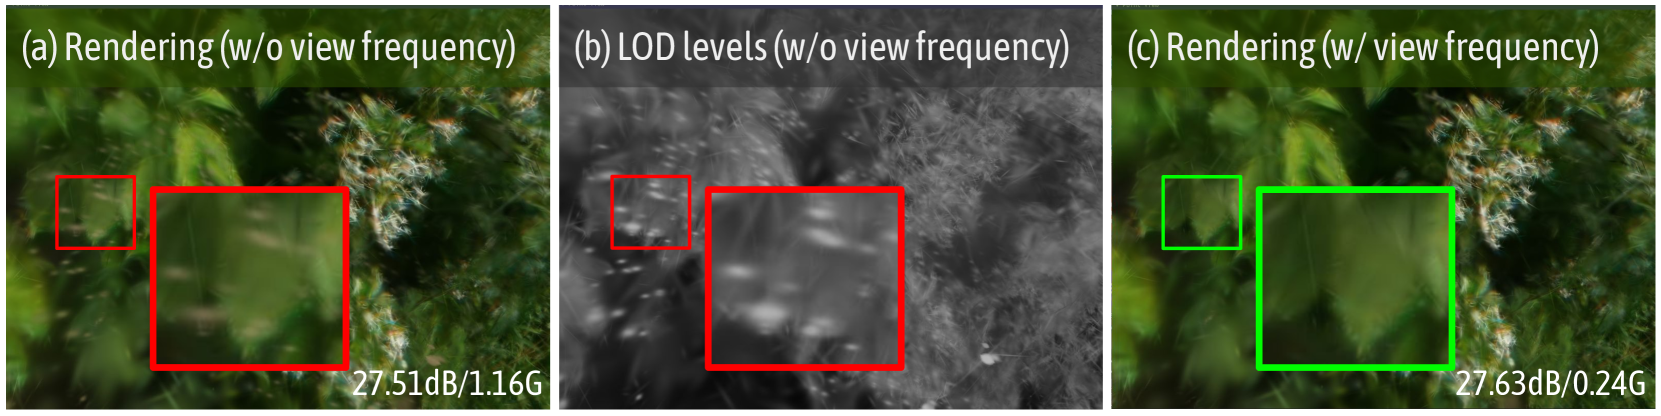
The image presents a side-by-side comparison of three renderings of a scene, likely a forest or vegetation, under different rendering conditions. Each rendering is enclosed in a red or green bounding box. The renderings are labeled (a), (b), and (c), with accompanying text describing the rendering parameters and a numerical value in the bottom-right corner.
### Components/Axes
The image consists of three distinct panels:
* **(a) Rendering (w/o view frequency):** A color rendering with a red bounding box.
* **(b) LOD levels (w/o view frequency):** A grayscale rendering with a red bounding box.
* **(c) Rendering (w/ view frequency):** A color rendering with a green bounding box.
Each panel also displays a numerical value in the bottom-right corner, formatted as "XX.XXdB/X.XXXG". This likely represents a signal-to-noise ratio (dB) and a data size (G).
### Detailed Analysis or Content Details
**Panel (a): Rendering (w/o view frequency)**
* The rendering is in full color, depicting foliage.
* A red bounding box is drawn around a section of the foliage.
* The numerical value displayed is 27.51dB/1.16G.
**Panel (b): LOD levels (w/o view frequency)**
* The rendering is grayscale, showing a blurred or low-detail representation of the scene.
* A red bounding box is drawn around a section of the scene.
* The numerical value displayed is 27.51dB/1.16G.
**Panel (c): Rendering (w/ view frequency)**
* The rendering is in full color, similar to panel (a), depicting foliage.
* A green bounding box is drawn around a section of the foliage.
* The numerical value displayed is 27.63dB/0.24G.
### Key Observations
* The renderings in panels (a) and (c) are in color, while panel (b) is grayscale.
* The bounding boxes in panels (a) and (b) are red, while the bounding box in panel (c) is green. This suggests a deliberate highlighting of specific areas for comparison.
* The numerical values are similar between panels (a) and (b) (27.51dB/1.16G), but different in panel (c) (27.63dB/0.24G). The dB value is slightly higher in (c), while the data size is significantly lower.
* The "w/o view frequency" and "w/ view frequency" labels suggest that the key difference between the renderings is the inclusion or exclusion of view frequency information in the rendering process.
* Panel (b) specifically mentions "LOD levels," indicating that this rendering is likely demonstrating the effect of Level of Detail (LOD) scaling.
### Interpretation
The image demonstrates a comparison of rendering techniques, specifically focusing on the impact of view frequency and Level of Detail (LOD).
* **Panels (a) and (b)** represent renderings *without* view frequency information. Panel (b) shows the effect of LOD scaling, resulting in a lower-detail, grayscale image. The similar dB/G values suggest that the signal-to-noise ratio and data size are comparable when view frequency is not considered.
* **Panel (c)** represents a rendering *with* view frequency information. The slightly higher dB value suggests a marginally improved signal-to-noise ratio, while the significantly lower data size (0.24G vs. 1.16G) indicates a substantial reduction in data requirements.
The image suggests that incorporating view frequency information into the rendering process can lead to a more efficient rendering pipeline, reducing data size without significantly compromising image quality (as indicated by the similar dB values). The use of bounding boxes highlights specific areas for visual comparison, likely to demonstrate the differences in detail and clarity between the rendering techniques. The grayscale image in (b) is likely a result of aggressive LOD scaling to reduce computational cost.