## Image Analysis: Rendering and LOD Levels with/without View Frequency
### Overview
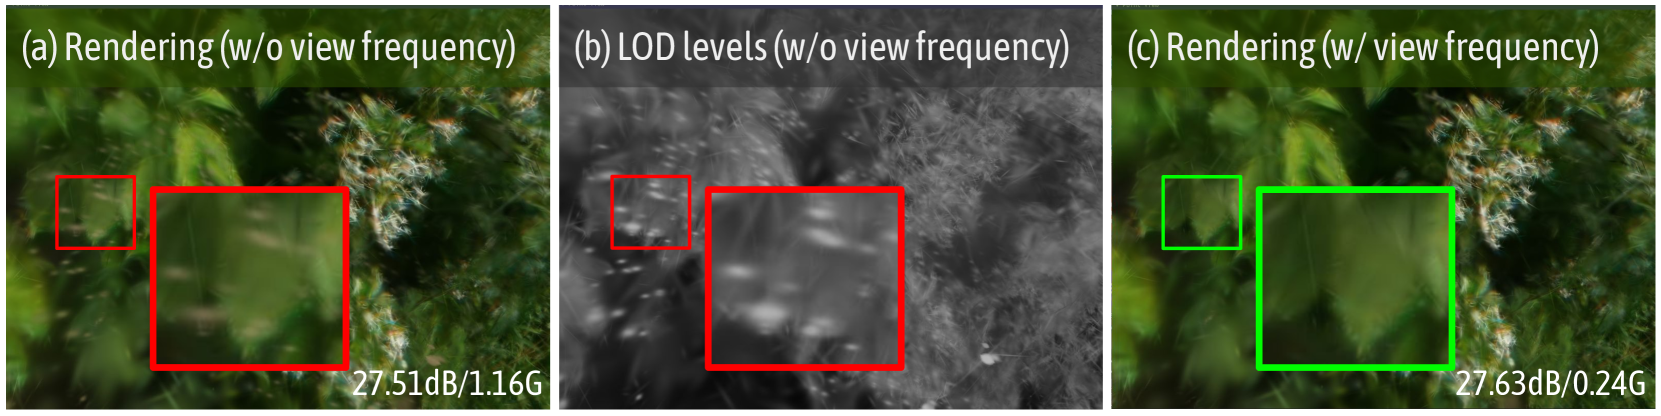
The image consists of three panels (a, b, c) comparing rendering quality and LOD (Level of Detail) levels in a natural scene (likely vegetation or foliage). Each panel includes highlighted regions (red/green boxes) and numerical metrics (dB and G values) in the bottom-right corner. The panels are labeled to indicate the presence or absence of "view frequency" in rendering and LOD calculations.
---
### Components/Axes
1. **Panels**:
- **(a) Rendering (w/o view frequency)**: Green foliage with red boxes highlighting specific areas. Metrics: **27.51dB/1.16G**.
- **(b) LOD levels (w/o view frequency)**: Grayscale image with red boxes. No explicit metrics.
- **(c) Rendering (w/ view frequency)**: Green foliage with a green box. Metrics: **27.63dB/0.24G**.
2. **Highlighted Regions**:
- **Red boxes** in panels (a) and (b) mark areas of interest for comparison.
- **Green box** in panel (c) highlights a region with improved rendering quality.
3. **Metrics**:
- **dB (Decibels)**: Likely represents brightness or signal-to-noise ratio.
- **G (Graininess)**: Likely represents noise or texture detail.
---
### Detailed Analysis
- **Panel (a)**:
- Rendering without view frequency shows moderate brightness (27.51dB) and higher graininess (1.16G). Red boxes highlight areas with visible texture.
- **Panel (b)**:
- LOD levels without view frequency are grayscale, emphasizing structural details. Red boxes align with panel (a), suggesting a focus on the same regions.
- **Panel (c)**:
- Rendering with view frequency shows slightly higher brightness (27.63dB) but significantly reduced graininess (0.24G). The green box highlights a region with smoother, more detailed rendering.
---
### Key Observations
1. **Brightness vs. Graininess Trade-off**:
- Adding view frequency (panel c) slightly increases brightness (0.12dB) but drastically reduces graininess (from 1.16G to 0.24G).
2. **Highlighted Regions**:
- Red boxes in (a) and (b) align spatially, indicating consistent focus areas. The green box in (c) suggests improved rendering in a specific sub-region.
3. **LOD Impact**:
- Panel (b) reveals underlying structural details (e.g., leaf veins) that are less visible in the colored renderings (a and c).
---
### Interpretation
- **View Frequency Enhancement**: The inclusion of view frequency in panel (c) improves rendering quality by reducing noise (lower G) while maintaining brightness. This suggests view frequency acts as a noise-reduction mechanism.
- **LOD vs. Rendering**: Panel (b) demonstrates that LOD levels without view frequency preserve structural details but lack color and brightness. This implies LOD calculations are critical for detail retention but require additional processing (e.g., view frequency) for realistic rendering.
- **Metrics Significance**: The dB values (brightness) are relatively stable, while G values (graininess) show a 79% reduction with view frequency. This highlights the importance of balancing brightness and noise in image processing.
---
### Spatial Grounding
- **Red Boxes**: Positioned in the lower-left and center regions of panels (a) and (b), aligning spatially to compare the same areas.
- **Green Box**: Located in the upper-right of panel (c), emphasizing a region with optimized rendering.
- **Metrics Placement**: All dB/G values are anchored to the bottom-right corner of their respective panels for consistency.
---
### Conclusion
The image illustrates how view frequency enhances rendering quality by reducing graininess while maintaining brightness. The LOD levels (panel b) provide a baseline for structural detail, which is refined in the final rendering (panel c). The metrics and highlighted regions underscore the trade-offs and benefits of incorporating view frequency in image processing pipelines.