## Pie Charts: Distribution of Recheck Types Across Exams
### Overview
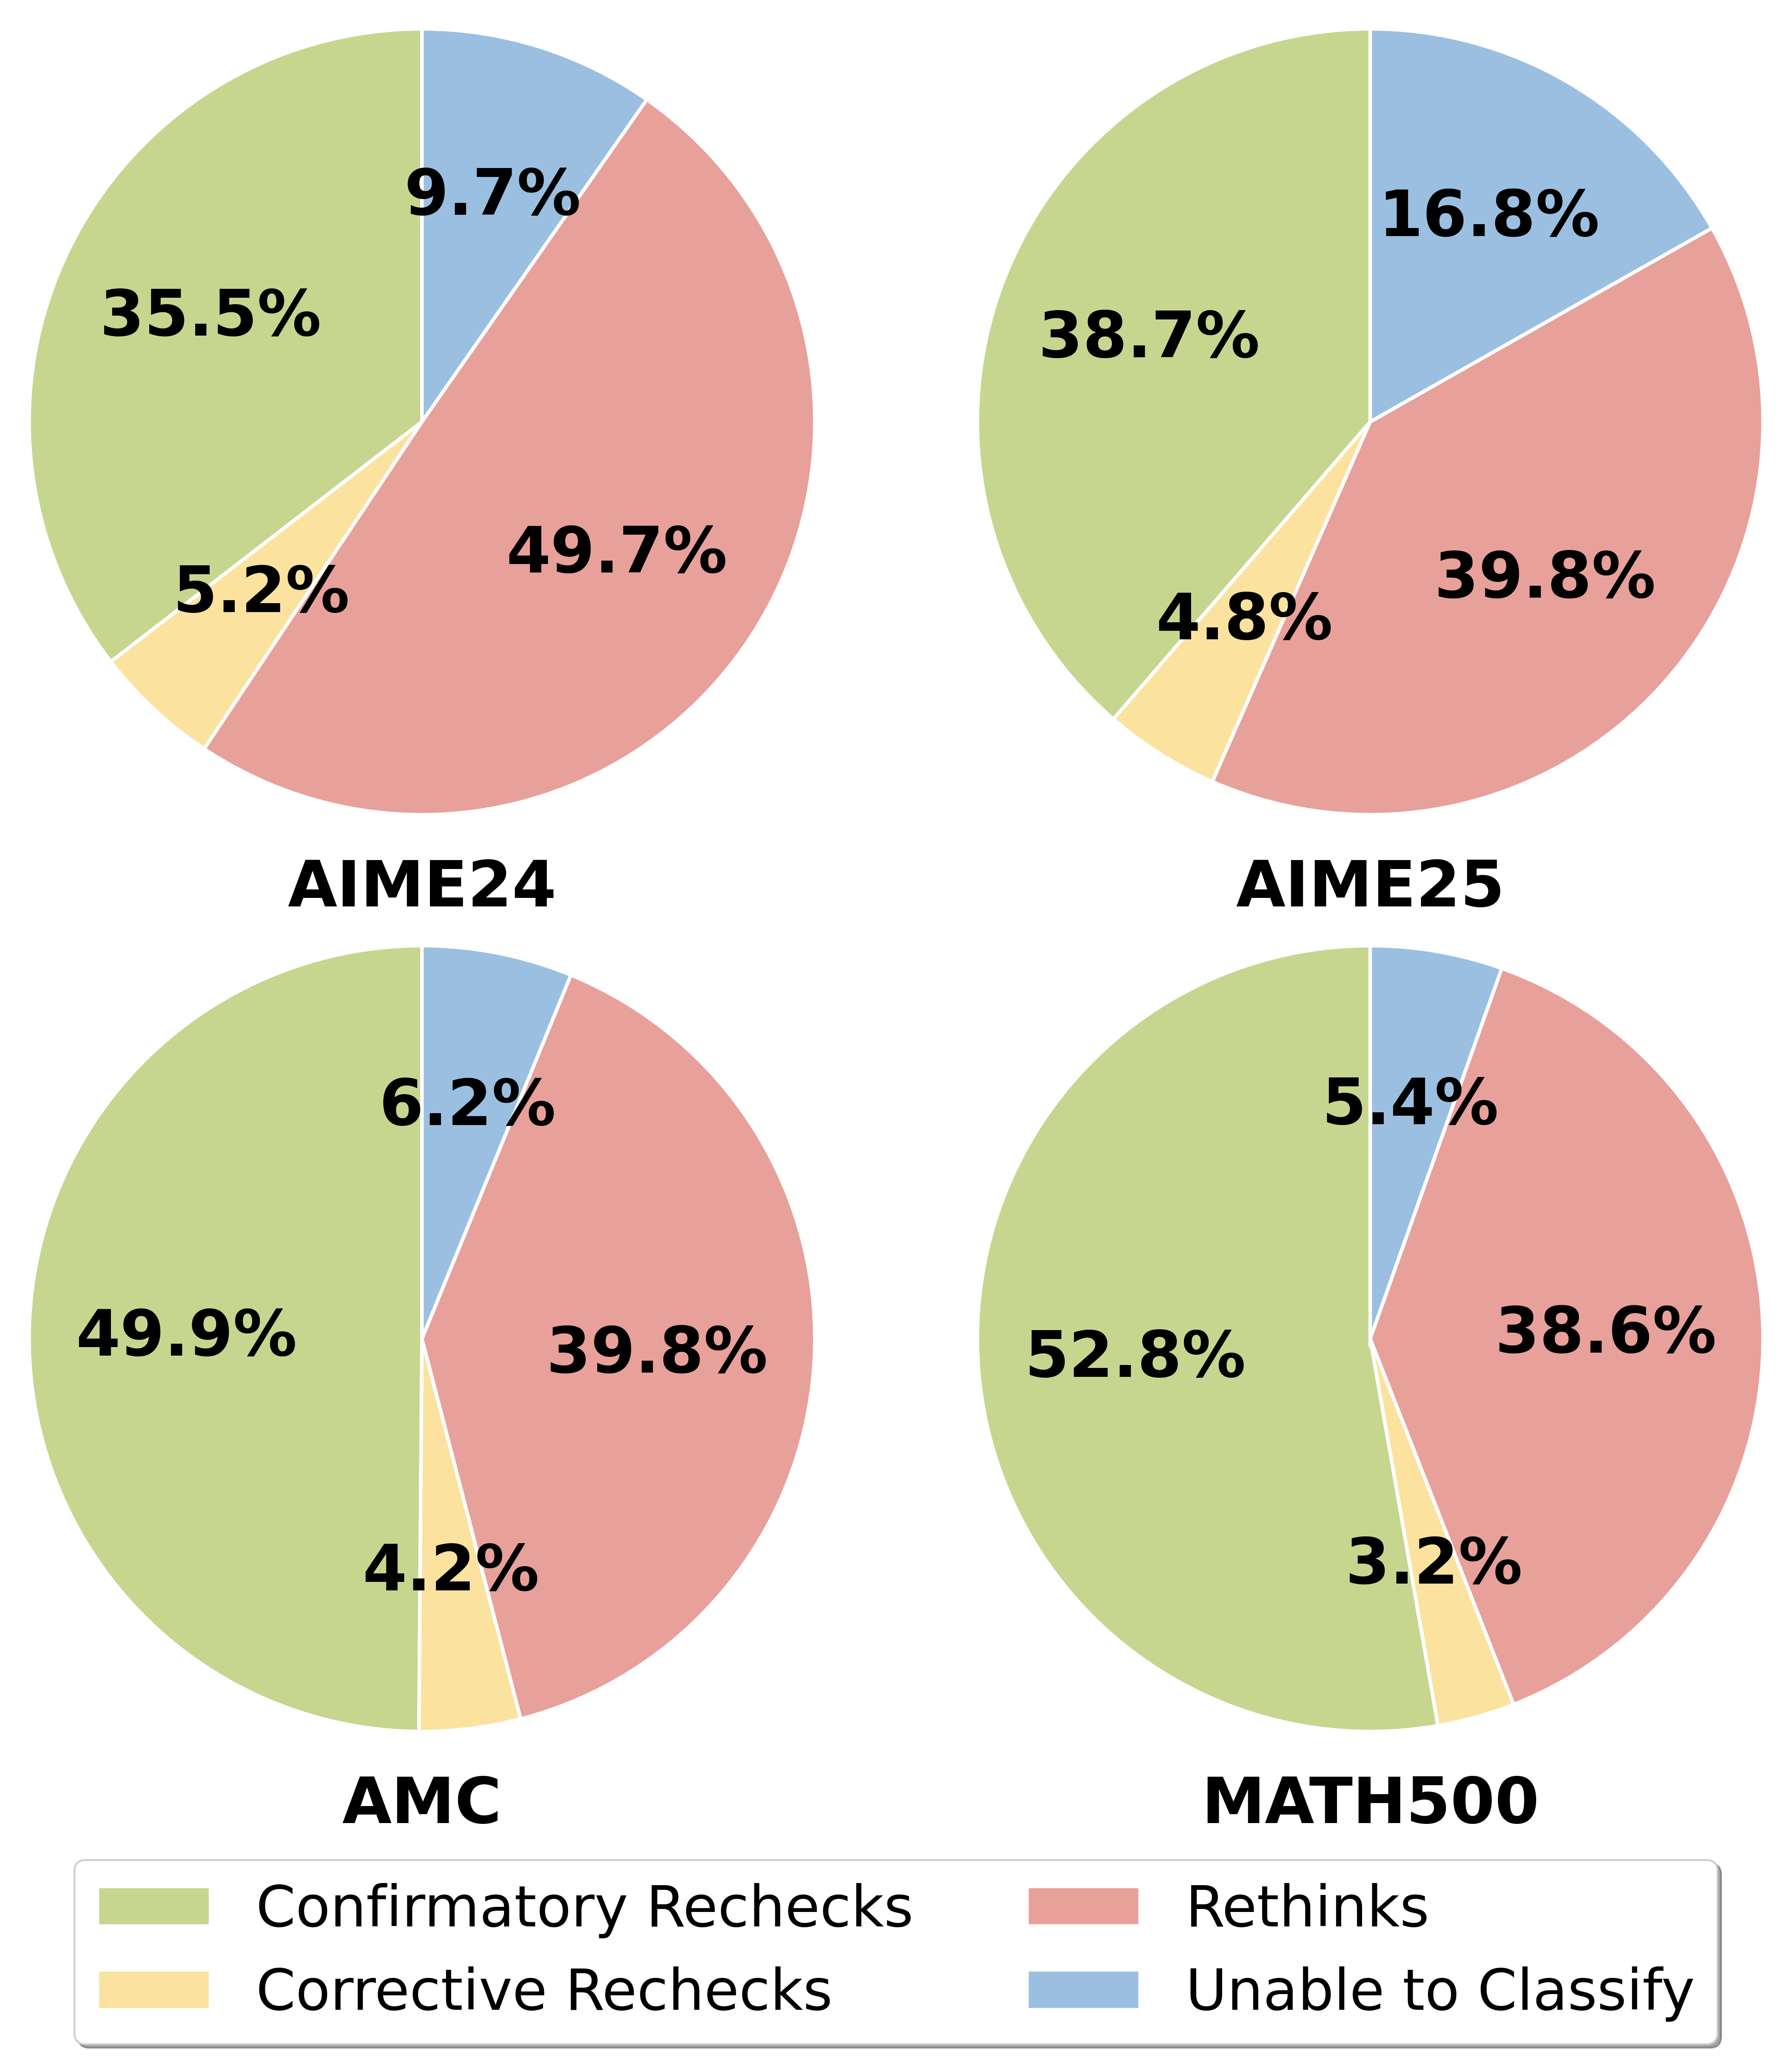
The image contains four pie charts comparing the distribution of four recheck categories ("Confirmatory Rechecks," "Rethinks," "Corrective Rechecks," "Unable to Classify") across four exams: AIME24, AIME25, AMC, and MATH500. Each chart uses distinct colors for categories, with a legend at the bottom for reference.
### Components/Axes
- **Legend**:
- Green: Confirmatory Rechecks
- Red: Rethinks
- Yellow: Corrective Rechecks
- Blue: Unable to Classify
- **Chart Labels**:
- Top-left: AIME24
- Top-right: AIME25
- Bottom-left: AMC
- Bottom-right: MATH500
### Detailed Analysis
#### AIME24
- Confirmatory Rechecks (green): 35.5%
- Rethinks (red): 49.7%
- Corrective Rechecks (yellow): 5.2%
- Unable to Classify (blue): 9.7%
#### AIME25
- Confirmatory Rechecks (green): 38.7%
- Rethinks (red): 39.8%
- Corrective Rechecks (yellow): 4.8%
- Unable to Classify (blue): 16.8%
#### AMC
- Confirmatory Rechecks (green): 49.9%
- Rethinks (red): 39.8%
- Corrective Rechecks (yellow): 4.2%
- Unable to Classify (blue): 6.2%
#### MATH500
- Confirmatory Rechecks (green): 52.8%
- Rethinks (red): 38.6%
- Corrective Rechecks (yellow): 3.2%
- Unable to Classify (blue): 5.4%
### Key Observations
1. **Dominant Categories**:
- Confirmatory Rechecks (green) are largest in AMC (49.9%) and MATH500 (52.8%).
- Rethinks (red) dominate AIME24 (49.7%) and are nearly equal to Confirmatory Rechecks in AIME25 (39.8% vs. 38.7%).
2. **Lowest Category**:
- Corrective Rechecks (yellow) are consistently the smallest, with MATH500 having the lowest at 3.2%.
3. **Unclassifiable Data**:
- AIME25 has the highest "Unable to Classify" (16.8%), suggesting potential issues in data categorization for this exam.
### Interpretation
The data reveals significant variability in recheck distributions across exams. AIME25 stands out for its high proportion of "Unable to Classify" (16.8%), which may indicate ambiguities in grading or classification criteria for this exam. MATH500 has the highest Confirmatory Rechecks (52.8%), suggesting stricter initial validation processes. The near-equal split between Confirmatory Rechecks and Rethinks in AIME25 (38.7% vs. 39.8%) implies a balanced reevaluation process. Corrective Rechecks remain consistently rare (<5% in all charts), highlighting their limited role in the workflow.
### Spatial Grounding
- **Legend**: Positioned at the bottom center, clearly associating colors with categories.
- **Charts**: Arranged in a 2x2 grid, with each exam’s chart occupying equal visual space.
- **Text**: All labels and percentages are embedded within the pie slices, with no external annotations.
### Trend Verification
- **Confirmatory Rechecks**: Increase from AIME24 (35.5%) to MATH500 (52.8%), showing a trend toward higher initial validation in later exams.
- **Rethinks**: Decrease from AIME24 (49.7%) to MATH500 (38.6%), indicating reduced need for reevaluation in later exams.
- **Unable to Classify**: Peaks in AIME25 (16.8%) before dropping to 5.4% in MATH500, suggesting improved classification accuracy over time.
### Component Isolation
- **Header**: Chart titles (AIME24, AIME25, AMC, MATH500) positioned above each pie chart.
- **Main Chart**: Pie slices with embedded percentages and color-coded segments.
- **Footer**: Legend explaining color mappings.
### Final Notes
All textual content is in English. No non-English elements are present. The data emphasizes the importance of exam-specific recheck strategies, with AIME25’s high "Unable to Classify" rate warranting further investigation into grading consistency.