## Pie Charts: Recheck Classification
### Overview
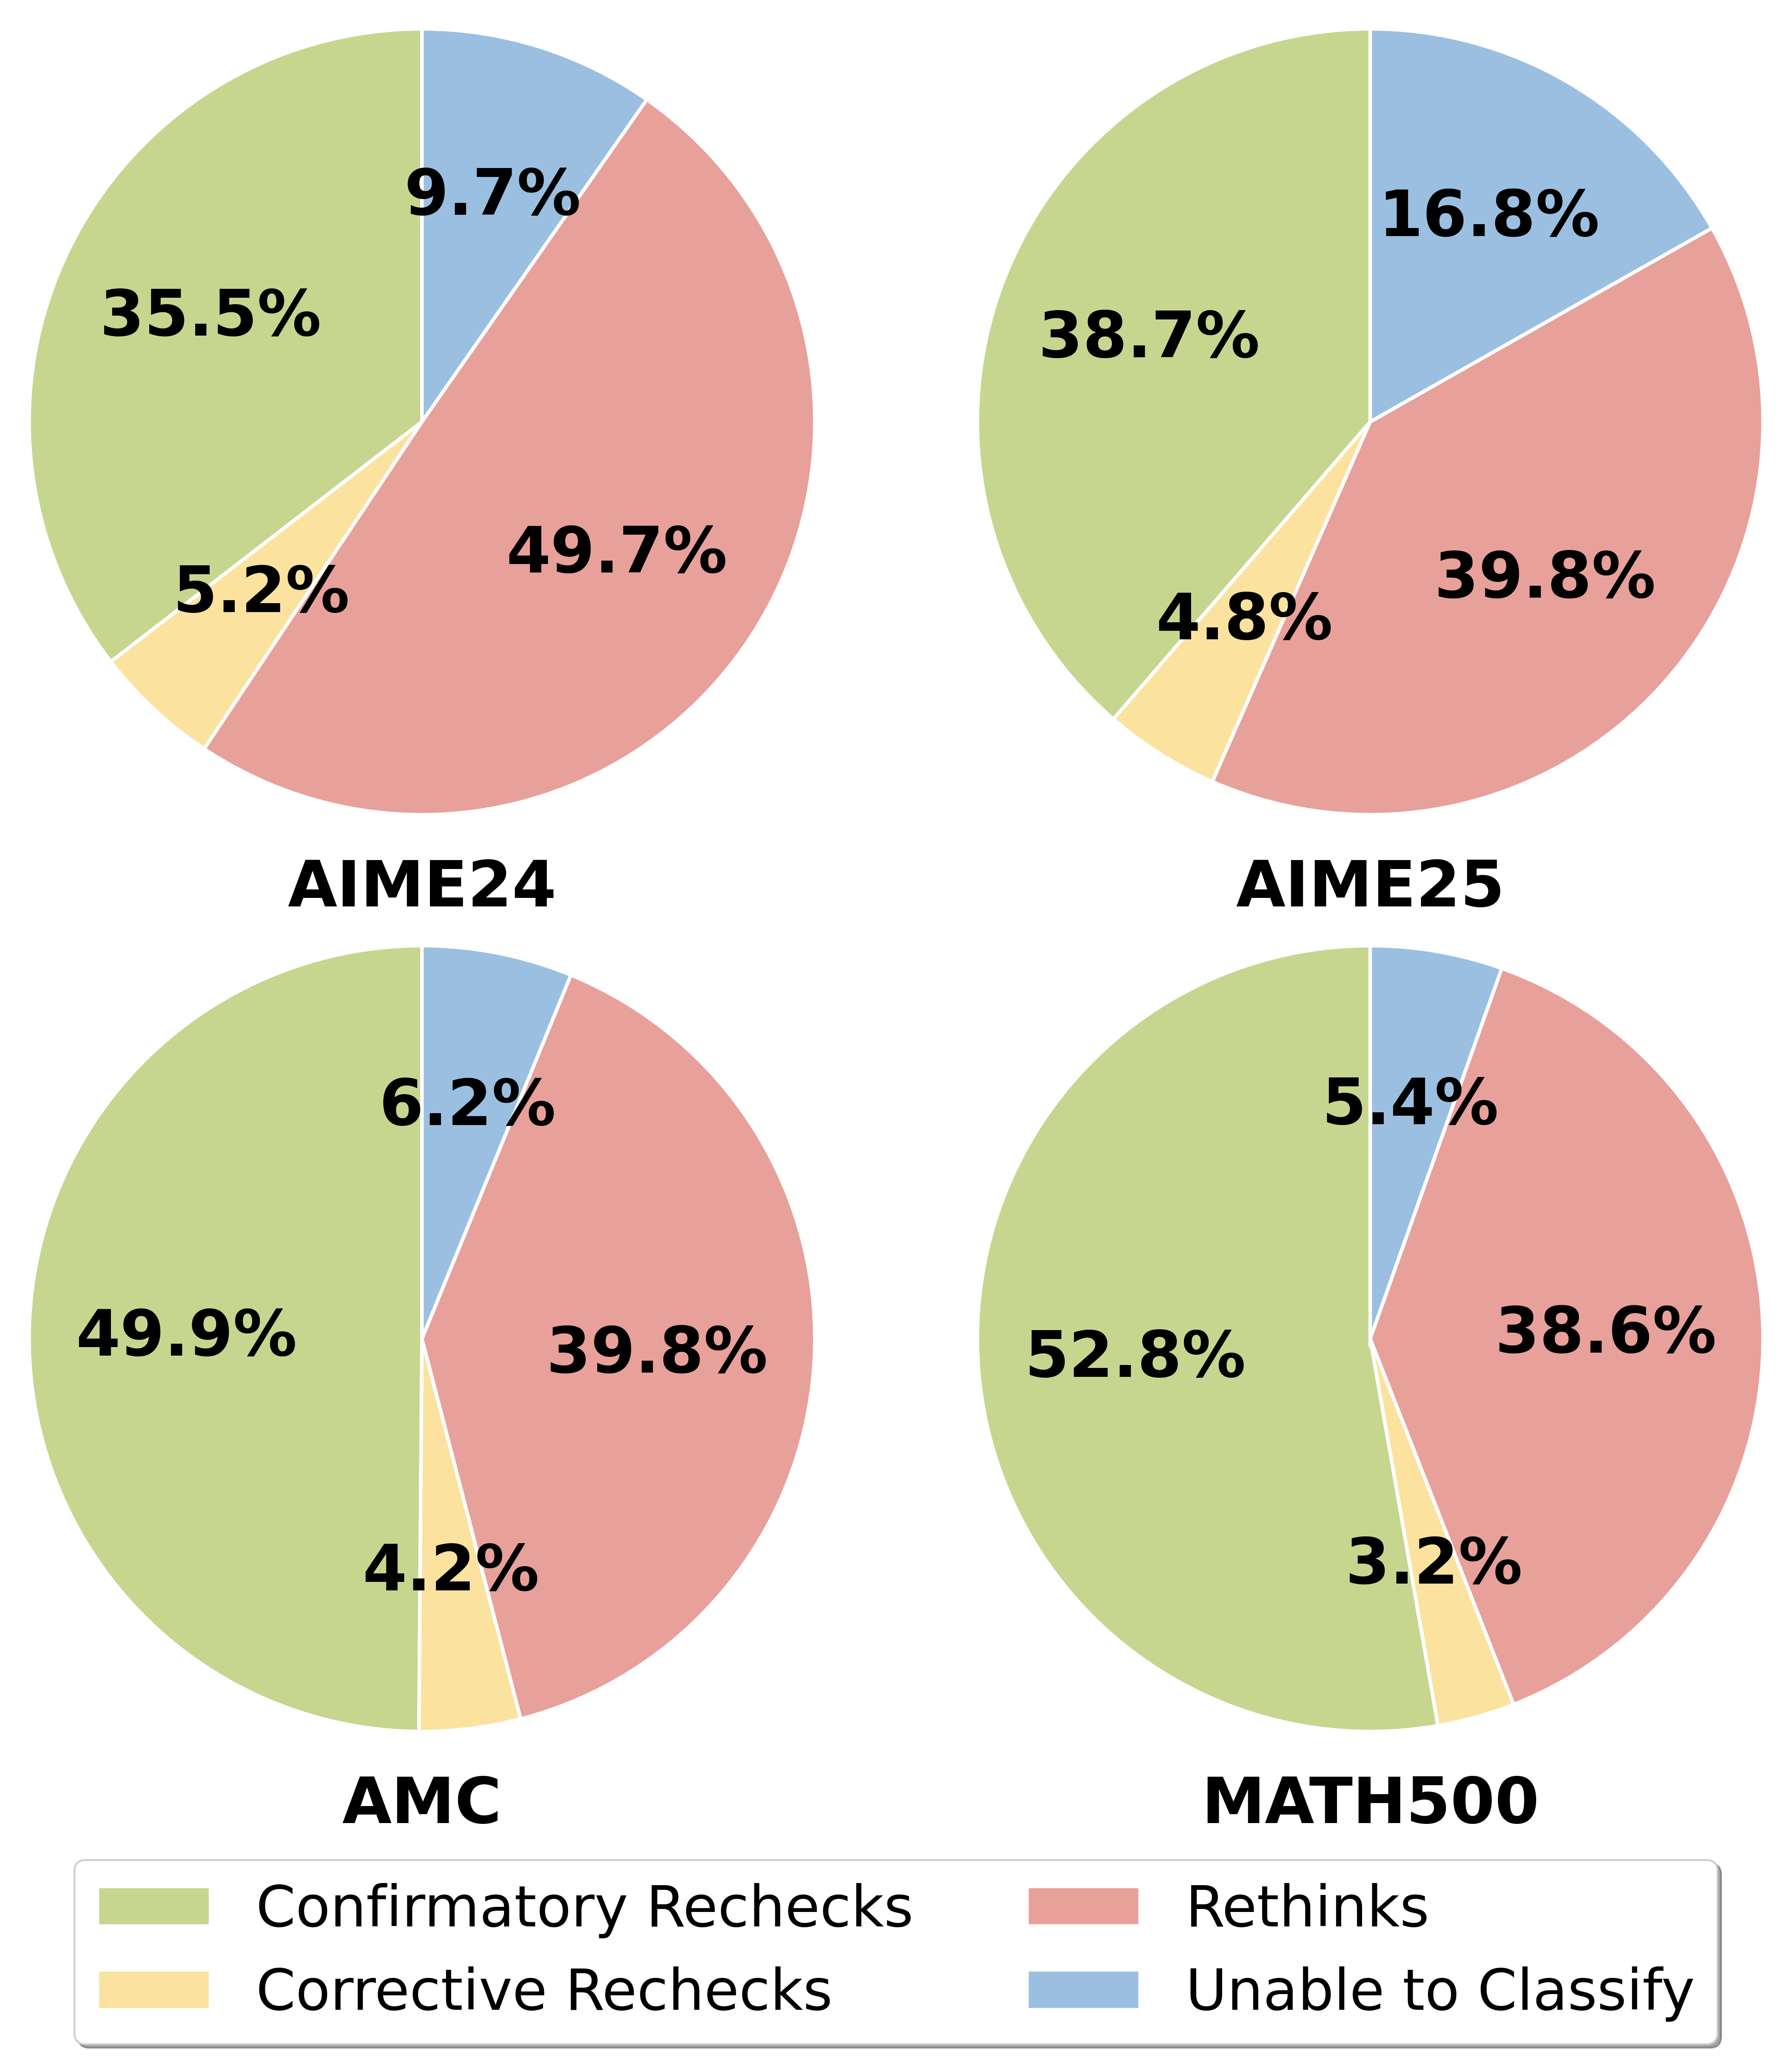
The image contains four pie charts, each representing the distribution of different types of rechecks ("Confirmatory Rechecks", "Corrective Rechecks", "Rethinks", and "Unable to Classify") for different datasets: AIME24, AIME25, AMC, and MATH500. The pie charts are arranged in a 2x2 grid. The legend is located at the bottom of the image.
### Components/Axes
* **Pie Charts:** Four pie charts labeled AIME24, AIME25, AMC, and MATH500.
* **Categories:**
* Confirmatory Rechecks (light green)
* Corrective Rechecks (light yellow)
* Rethinks (light red)
* Unable to Classify (light blue)
* **Legend:** Located at the bottom of the image, associating colors with recheck types.
### Detailed Analysis or ### Content Details
**AIME24 (Top Left)**
* Confirmatory Rechecks (light green): 35.5%
* Corrective Rechecks (light yellow): 5.2%
* Rethinks (light red): 49.7%
* Unable to Classify (light blue): 9.7%
**AIME25 (Top Right)**
* Confirmatory Rechecks (light green): 38.7%
* Corrective Rechecks (light yellow): 4.8%
* Rethinks (light red): 39.8%
* Unable to Classify (light blue): 16.8%
**AMC (Bottom Left)**
* Confirmatory Rechecks (light green): 49.9%
* Corrective Rechecks (light yellow): 4.2%
* Rethinks (light red): 39.8%
* Unable to Classify (light blue): 6.2%
**MATH500 (Bottom Right)**
* Confirmatory Rechecks (light green): 52.8%
* Corrective Rechecks (light yellow): 3.2%
* Rethinks (light red): 38.6%
* Unable to Classify (light blue): 5.4%
### Key Observations
* **Rethinks vs. Confirmatory Rechecks:** In AIME24, "Rethinks" constitute the largest portion (49.7%), while in AMC and MATH500, "Confirmatory Rechecks" are the largest (49.9% and 52.8% respectively).
* **Corrective Rechecks:** "Corrective Rechecks" consistently have the smallest percentage across all datasets, ranging from 3.2% to 5.2%.
* **Unable to Classify:** The "Unable to Classify" category varies, with AIME25 having the highest percentage (16.8%) and MATH500 having the lowest (5.4%).
### Interpretation
The pie charts provide a comparative view of how different types of rechecks are distributed across various datasets (AIME24, AIME25, AMC, MATH500). The data suggests that the nature of rechecks varies depending on the dataset. For instance, AIME24 has a higher proportion of "Rethinks" compared to "Confirmatory Rechecks," while AMC and MATH500 show the opposite trend. The consistently low percentage of "Corrective Rechecks" might indicate that these types of errors are less frequent or are handled differently in the respective datasets. The variability in the "Unable to Classify" category could reflect differences in the complexity or ambiguity of the problems within each dataset.