## Pie Charts: Recheck and Rethink Distribution Across Datasets
### Overview
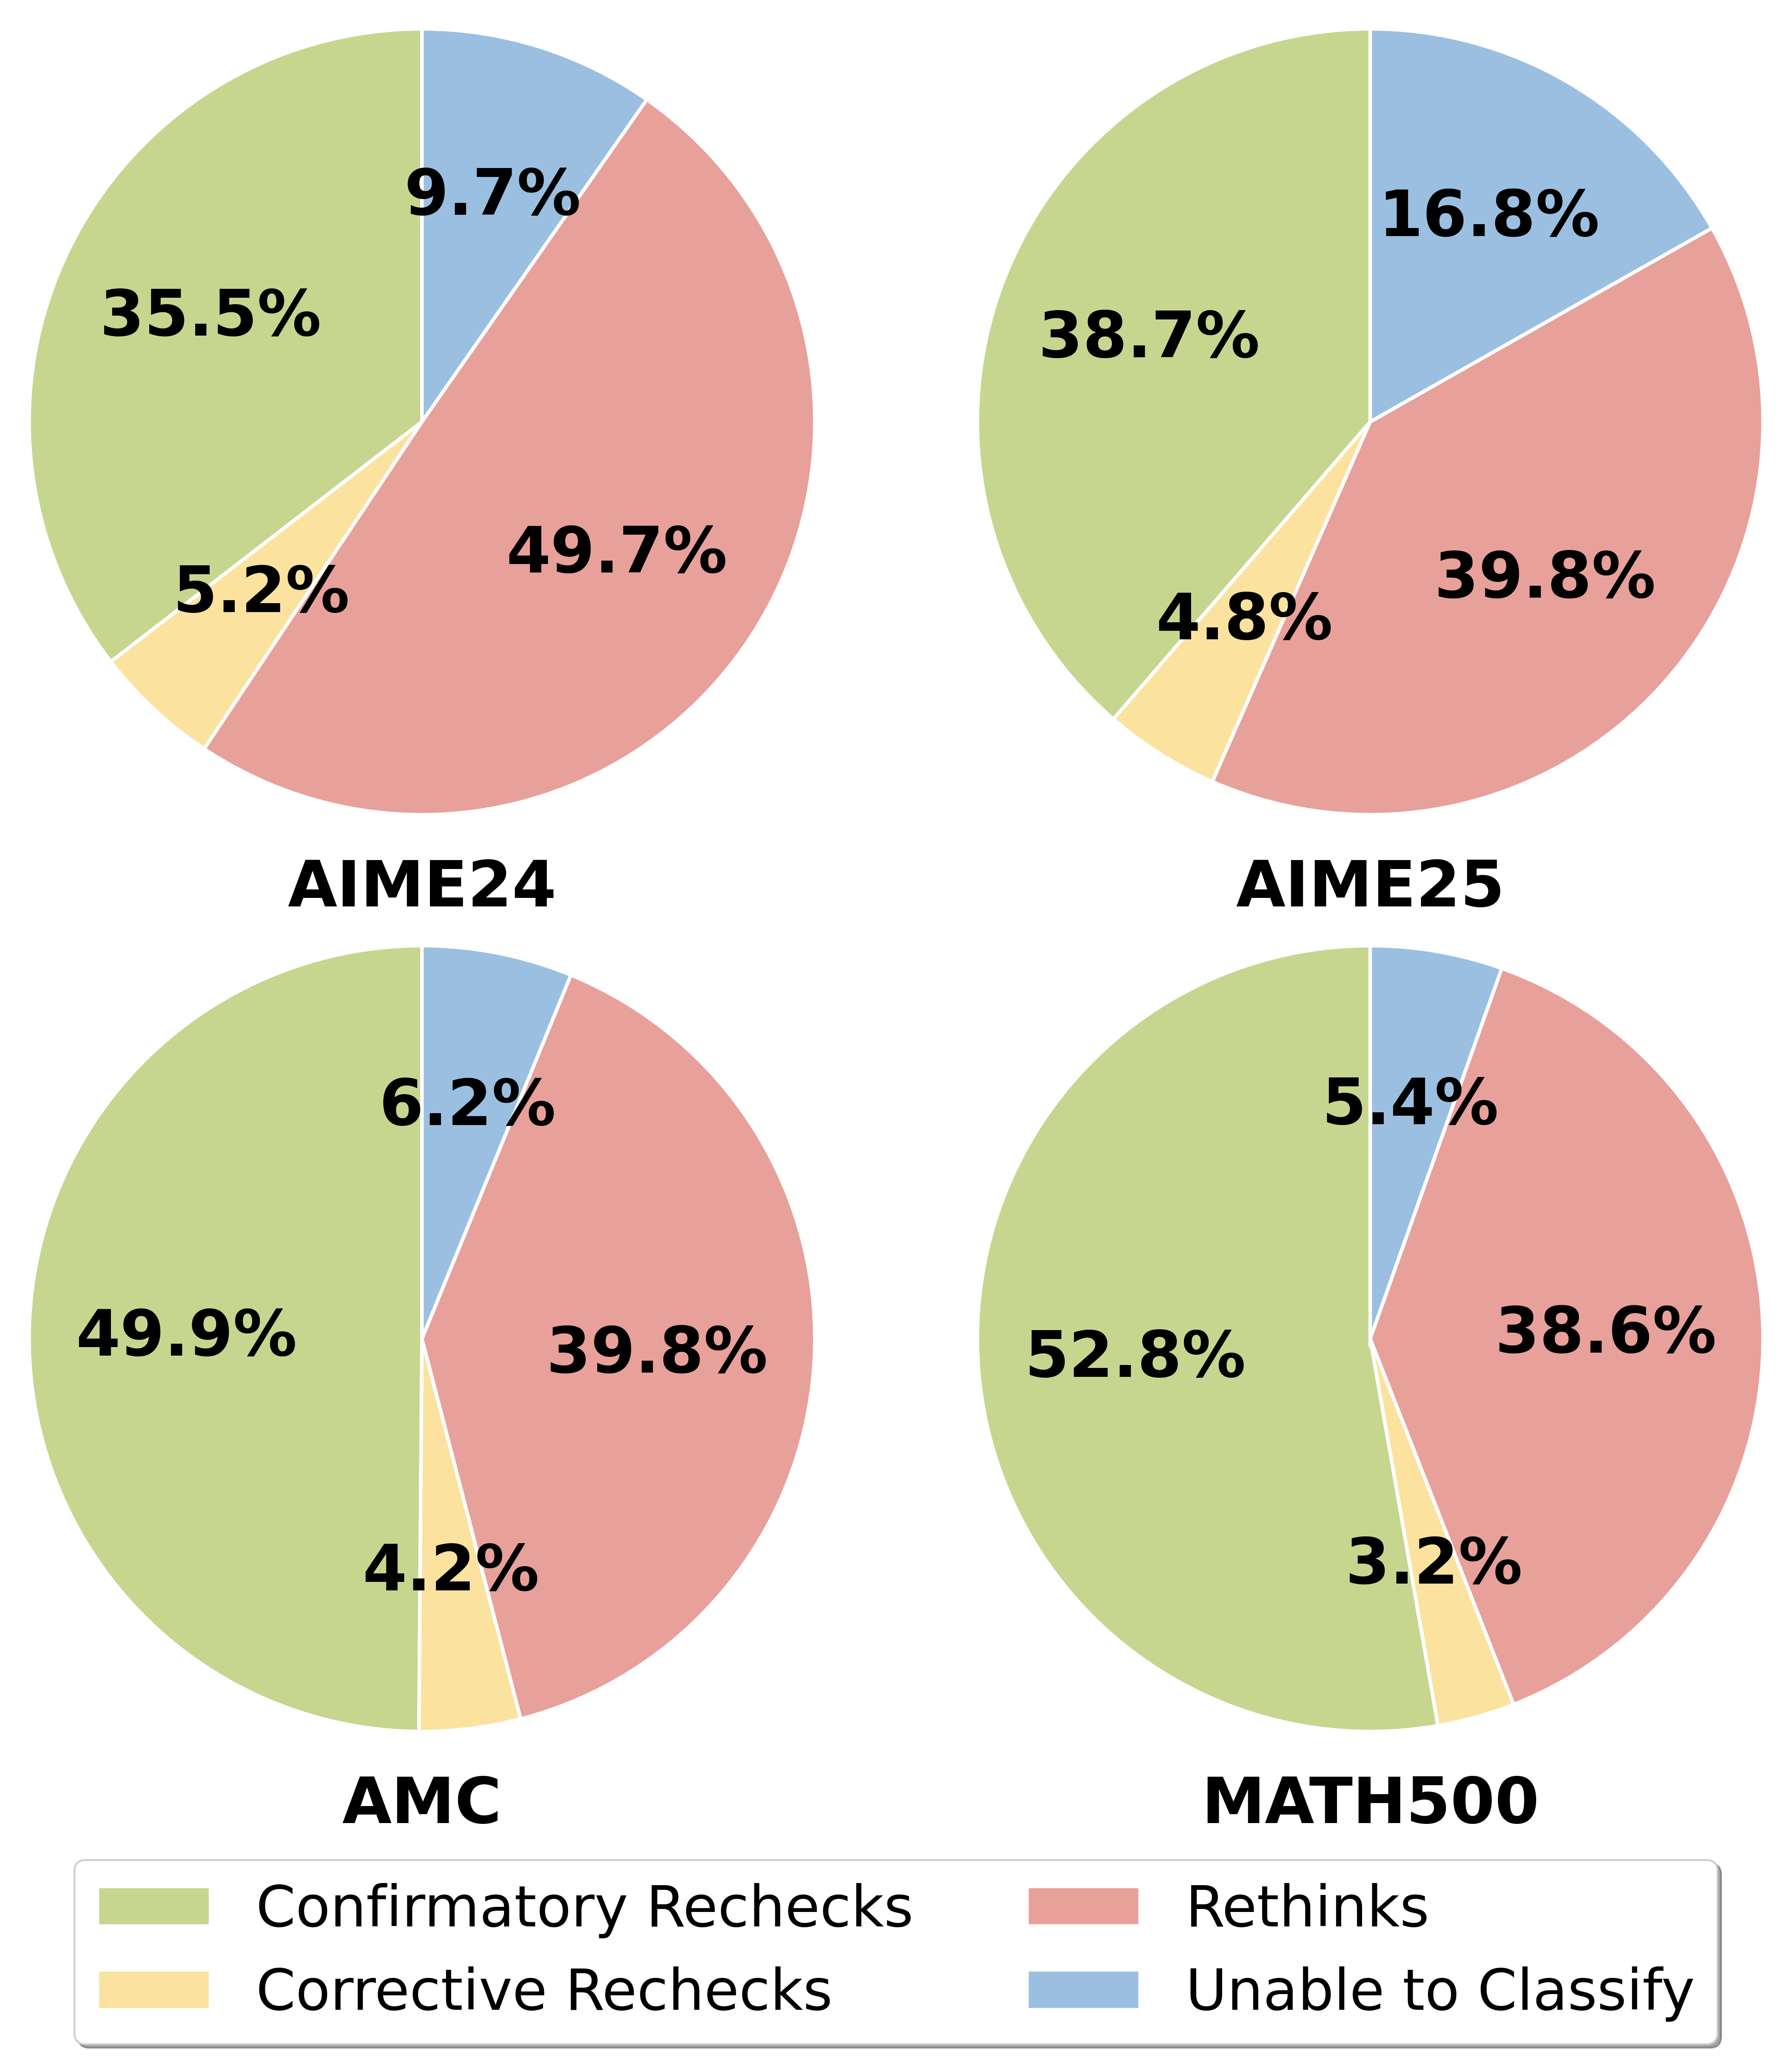
The image presents four pie charts, each representing the distribution of different types of rechecks and rethinks for four datasets: AIME24, AIME25, AMC, and MATH500. The charts show the percentage breakdown of "Confirmatory Rechecks", "Corrective Rechecks", "Rethinks", and "Unable to Classify" within each dataset.
### Components/Axes
Each pie chart is labeled with the dataset name (AIME24, AIME25, AMC, MATH500) positioned at the bottom center. A legend is located at the bottom-left of the image, providing color-coding for each category:
* **Confirmatory Rechecks:** Light Green
* **Corrective Rechecks:** Light Yellow
* **Rethinks:** Light Red/Pink
* **Unable to Classify:** Light Blue
Each slice of the pie chart is labeled with a percentage value, indicating the proportion of that category within the dataset.
### Detailed Analysis or Content Details
**AIME24:**
* Confirmatory Rechecks: 35.5% (Light Green)
* Corrective Rechecks: 5.2% (Light Yellow)
* Rethinks: 49.7% (Light Red/Pink)
* Unable to Classify: 9.7% (Light Blue)
**AIME25:**
* Confirmatory Rechecks: 38.7% (Light Green)
* Corrective Rechecks: 4.8% (Light Yellow)
* Rethinks: 39.8% (Light Red/Pink)
* Unable to Classify: 16.8% (Light Blue)
**AMC:**
* Confirmatory Rechecks: 49.9% (Light Green)
* Corrective Rechecks: 4.2% (Light Yellow)
* Rethinks: 39.8% (Light Red/Pink)
* Unable to Classify: 6.2% (Light Blue)
**MATH500:**
* Confirmatory Rechecks: 52.8% (Light Green)
* Corrective Rechecks: 3.2% (Light Yellow)
* Rethinks: 38.6% (Light Red/Pink)
* Unable to Classify: 5.4% (Light Blue)
### Key Observations
* **Rethinks** consistently represent a significant portion of the rechecks across all datasets, ranging from approximately 38.6% to 49.7%.
* **Confirmatory Rechecks** are also a substantial component, ranging from 35.5% to 52.8%.
* **Corrective Rechecks** consistently have the lowest percentage across all datasets, remaining below 6.2%.
* **Unable to Classify** varies more significantly, from 3.2% in MATH500 to 16.8% in AIME25.
* MATH500 has the highest percentage of Confirmatory Rechecks (52.8%) and the lowest percentage of Unable to Classify (3.2%).
* AIME25 has the highest percentage of Unable to Classify (16.8%) and the lowest percentage of Corrective Rechecks (4.8%).
### Interpretation
The data suggests that a large proportion of rechecks are either confirming existing assessments (Confirmatory Rechecks) or involve a complete reassessment of the problem (Rethinks). The relatively low percentage of Corrective Rechecks indicates that errors requiring minor adjustments are infrequent. The variation in the "Unable to Classify" category suggests that some datasets are more challenging to categorize than others, potentially due to ambiguity in the recheck process or the nature of the problems themselves.
The differences between datasets could be due to several factors: the difficulty of the problems within each dataset, the experience level of the recheckers, or the specific criteria used for classification. For example, the higher proportion of Confirmatory Rechecks in MATH500 might indicate that the problems in this dataset are more straightforward and less prone to misinterpretation. The higher proportion of "Unable to Classify" in AIME25 could suggest that the problems in this dataset are more complex or ambiguous, making it difficult to determine the nature of the recheck.
Further investigation would be needed to understand the reasons behind these differences and to identify potential areas for improvement in the recheck process. It would be useful to analyze the specific problems that fall into the "Unable to Classify" category to determine the source of the ambiguity.