## Chart: Parameter Count vs. Computational Cost
### Overview
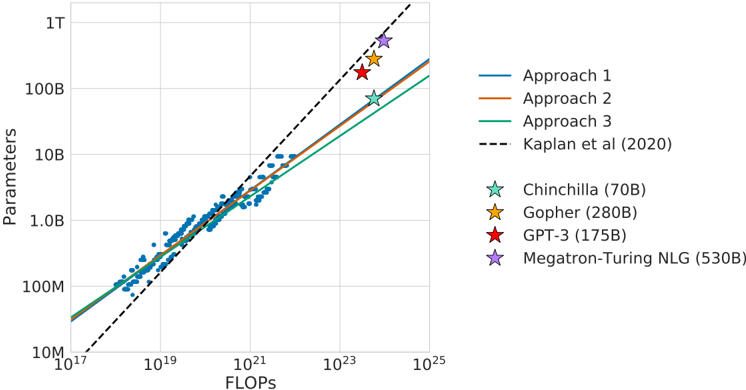
This chart depicts the relationship between the number of parameters in a language model and the computational cost (measured in FLOPS) required to train it. It compares three different approaches to scaling language models with a theoretical scaling law proposed by Kaplan et al. (2020). Several specific models are plotted as data points to illustrate their parameter count and FLOPS.
### Components/Axes
* **X-axis:** FLOPS (Floating Point Operations Per Second), logarithmic scale from 10<sup>17</sup> to 10<sup>25</sup>.
* **Y-axis:** Parameters, logarithmic scale from 10<sup>7</sup> to 1 T (10<sup>12</sup>).
* **Lines:**
* Approach 1 (Blue)
* Approach 2 (Orange)
* Approach 3 (Green)
* **Theoretical Line:** Kaplan et al. (2020) (Black dashed line)
* **Data Points (Models):**
* Chinchilla (70B parameters) (Teal star)
* Gopher (280B parameters) (Yellow star)
* GPT-3 (175B parameters) (Red star)
* Megatron-Turing NLG (530B parameters) (Purple star)
* **Legend:** Located in the top-right corner, associating colors with the different approaches and the Kaplan et al. line.
### Detailed Analysis
The chart shows a strong positive correlation between parameters and FLOPS. All three approaches demonstrate that increasing the number of parameters requires a significant increase in computational cost.
* **Kaplan et al. (2020):** The black dashed line represents a theoretical scaling law. It slopes upward from approximately 10<sup>17</sup> FLOPS and 10<sup>7</sup> parameters to 10<sup>25</sup> FLOPS and 10<sup>12</sup> parameters.
* **Approach 1 (Blue):** This line starts at approximately 10<sup>18</sup> FLOPS and 10<sup>8</sup> parameters and slopes upward, remaining below the Kaplan et al. line.
* **Approach 2 (Orange):** This line starts at approximately 10<sup>19</sup> FLOPS and 10<sup>8</sup> parameters and slopes upward, intersecting the Kaplan et al. line around 10<sup>23</sup> FLOPS.
* **Approach 3 (Green):** This line starts at approximately 10<sup>19</sup> FLOPS and 10<sup>8</sup> parameters and slopes upward, remaining above the Kaplan et al. line.
**Data Point Values (Approximate):**
* **Chinchilla (70B):** Approximately 10<sup>21</sup> FLOPS and 7 x 10<sup>10</sup> parameters.
* **Gopher (280B):** Approximately 10<sup>23</sup> FLOPS and 2.8 x 10<sup>11</sup> parameters.
* **GPT-3 (175B):** Approximately 10<sup>23</sup> FLOPS and 1.75 x 10<sup>11</sup> parameters.
* **Megatron-Turing NLG (530B):** Approximately 10<sup>24</sup> FLOPS and 5.3 x 10<sup>11</sup> parameters.
### Key Observations
* The models generally fall along the trend lines, but there is some deviation.
* Megatron-Turing NLG (530B) requires the highest FLOPS and has the largest number of parameters.
* Chinchilla (70B) has the lowest FLOPS and parameter count among the plotted models.
* Approach 3 consistently requires the most FLOPS for a given number of parameters.
* Approach 1 consistently requires the least FLOPS for a given number of parameters.
### Interpretation
The chart demonstrates the computational cost associated with scaling language models. The different approaches suggest trade-offs between parameter count and computational efficiency. The Kaplan et al. line provides a theoretical benchmark, and the plotted models show how real-world models compare to this benchmark. The deviations from the theoretical line could be due to various factors, such as differences in model architecture, training data, and optimization techniques. The chart highlights the significant computational resources required to train large language models, and the need for efficient scaling strategies. The positioning of the models relative to the theoretical line and the different approaches suggests that some models may be over- or under-trained for their parameter count, or that different training strategies are more or less efficient. The data suggests that simply increasing parameters does not guarantee improved performance and that optimizing the training process is crucial.