## Chart/Diagram Type: Combined Line Plot and Bar Chart
### Overview
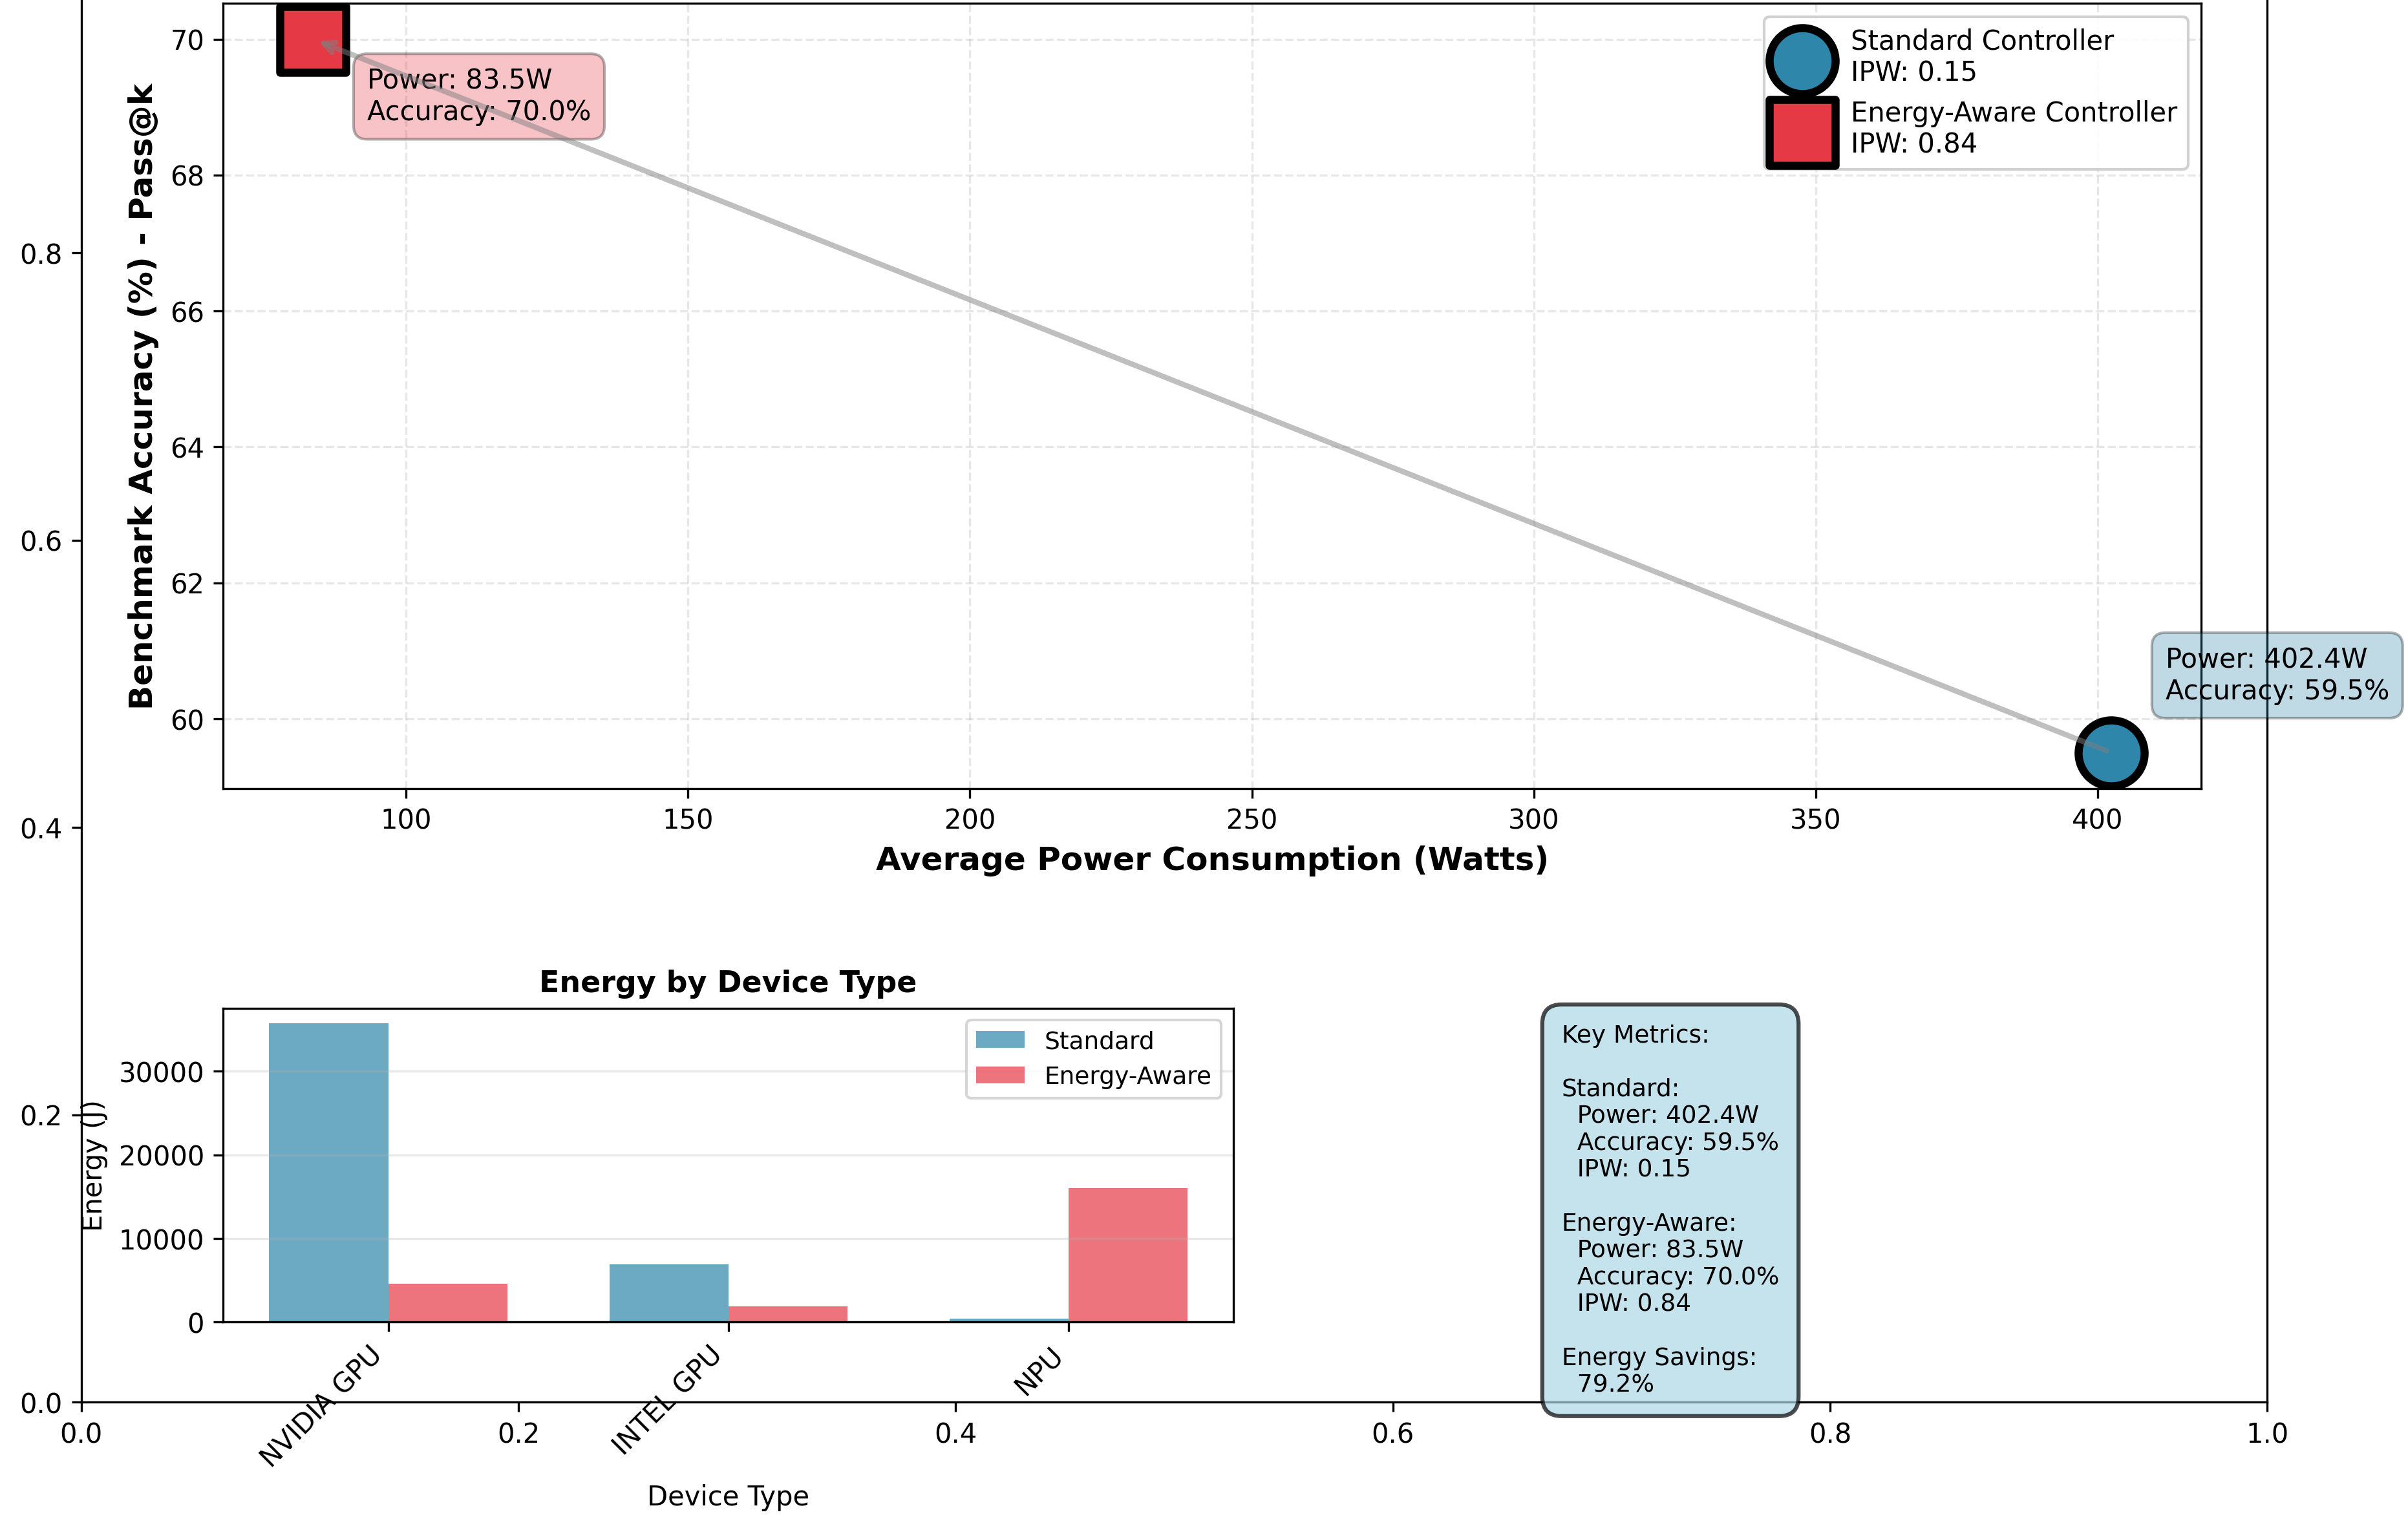
The image presents a combined visualization consisting of a line plot showing the relationship between benchmark accuracy and average power consumption, and a bar chart comparing energy consumption by device type for standard and energy-aware controllers. Key metrics for both controller types are also provided in a text box.
### Components/Axes
**Main Plot:**
* **X-axis:** Average Power Consumption (Watts), ranging from 100 to 400 in increments of 50.
* **Y-axis:** Benchmark Accuracy (%) - Pass@k, ranging from 0.4 to 0.8 in increments of 0.2, and 60 to 70 in increments of 2.
* **Data Series:** A single line plot in light gray, representing the relationship between average power consumption and benchmark accuracy.
* **Legend:**
* Top-right corner:
* Blue Circle: Standard Controller, IPW: 0.15
* Red Square: Energy-Aware Controller, IPW: 0.84
* **Data Points:**
* Energy-Aware Controller (Red Square): Located at approximately (83.5W, 70.0% accuracy).
* Standard Controller (Blue Circle): Located at approximately (402.4W, 59.5% accuracy).
**Bar Chart:**
* **Title:** Energy by Device Type
* **X-axis:** Device Type, with categories: NVIDIA GPU, INTEL GPU, NPU.
* **Y-axis:** Energy (J), ranging from 0 to 30000 in increments of 10000.
* **Legend:**
* Top-right corner of the bar chart:
* Blue: Standard
* Red: Energy-Aware
**Key Metrics Text Box:**
* Located in the bottom-right corner.
* Contains the following information:
* Standard:
* Power: 402.4W
* Accuracy: 59.5%
* IPW: 0.15
* Energy-Aware:
* Power: 83.5W
* Accuracy: 70.0%
* IPW: 0.84
* Energy Savings: 79.2%
### Detailed Analysis
**Main Plot:**
* The line plot shows a negative correlation between average power consumption and benchmark accuracy. As power consumption increases, benchmark accuracy decreases.
* The Energy-Aware Controller (red square) has lower power consumption (83.5W) and higher accuracy (70.0%) compared to the Standard Controller (blue circle), which has higher power consumption (402.4W) and lower accuracy (59.5%).
**Bar Chart:**
* **NVIDIA GPU:**
* Standard: Approximately 33000 J
* Energy-Aware: Approximately 5000 J
* **INTEL GPU:**
* Standard: Approximately 7000 J
* Energy-Aware: Approximately 2000 J
* **NPU:**
* Standard: Approximately 1000 J
* Energy-Aware: Approximately 16000 J
### Key Observations
* The Energy-Aware Controller significantly reduces power consumption compared to the Standard Controller, while also improving benchmark accuracy.
* The bar chart highlights the energy savings achieved by the Energy-Aware Controller across different device types, except for the NPU, where the Energy-Aware controller consumes significantly more energy.
* The Key Metrics box quantifies the power, accuracy, and IPW (Inference Per Watt) for both controller types, as well as the overall energy savings.
### Interpretation
The data suggests that the Energy-Aware Controller is more efficient than the Standard Controller, as it achieves higher benchmark accuracy with significantly lower power consumption for NVIDIA and INTEL GPUs. However, the NPU shows a reverse trend, with the Energy-Aware controller consuming more energy. The overall energy savings of 79.2% indicate the potential benefits of using the Energy-Aware Controller in certain applications. The IPW values further support this conclusion, as the Energy-Aware Controller has a much higher IPW (0.84) compared to the Standard Controller (0.15), indicating better energy efficiency. The negative correlation between power consumption and benchmark accuracy suggests a trade-off between these two factors, which the Energy-Aware Controller aims to optimize.