## Scatter Plot with Bar Chart Inset: Energy-Aware vs. Standard Controller Performance
### Overview
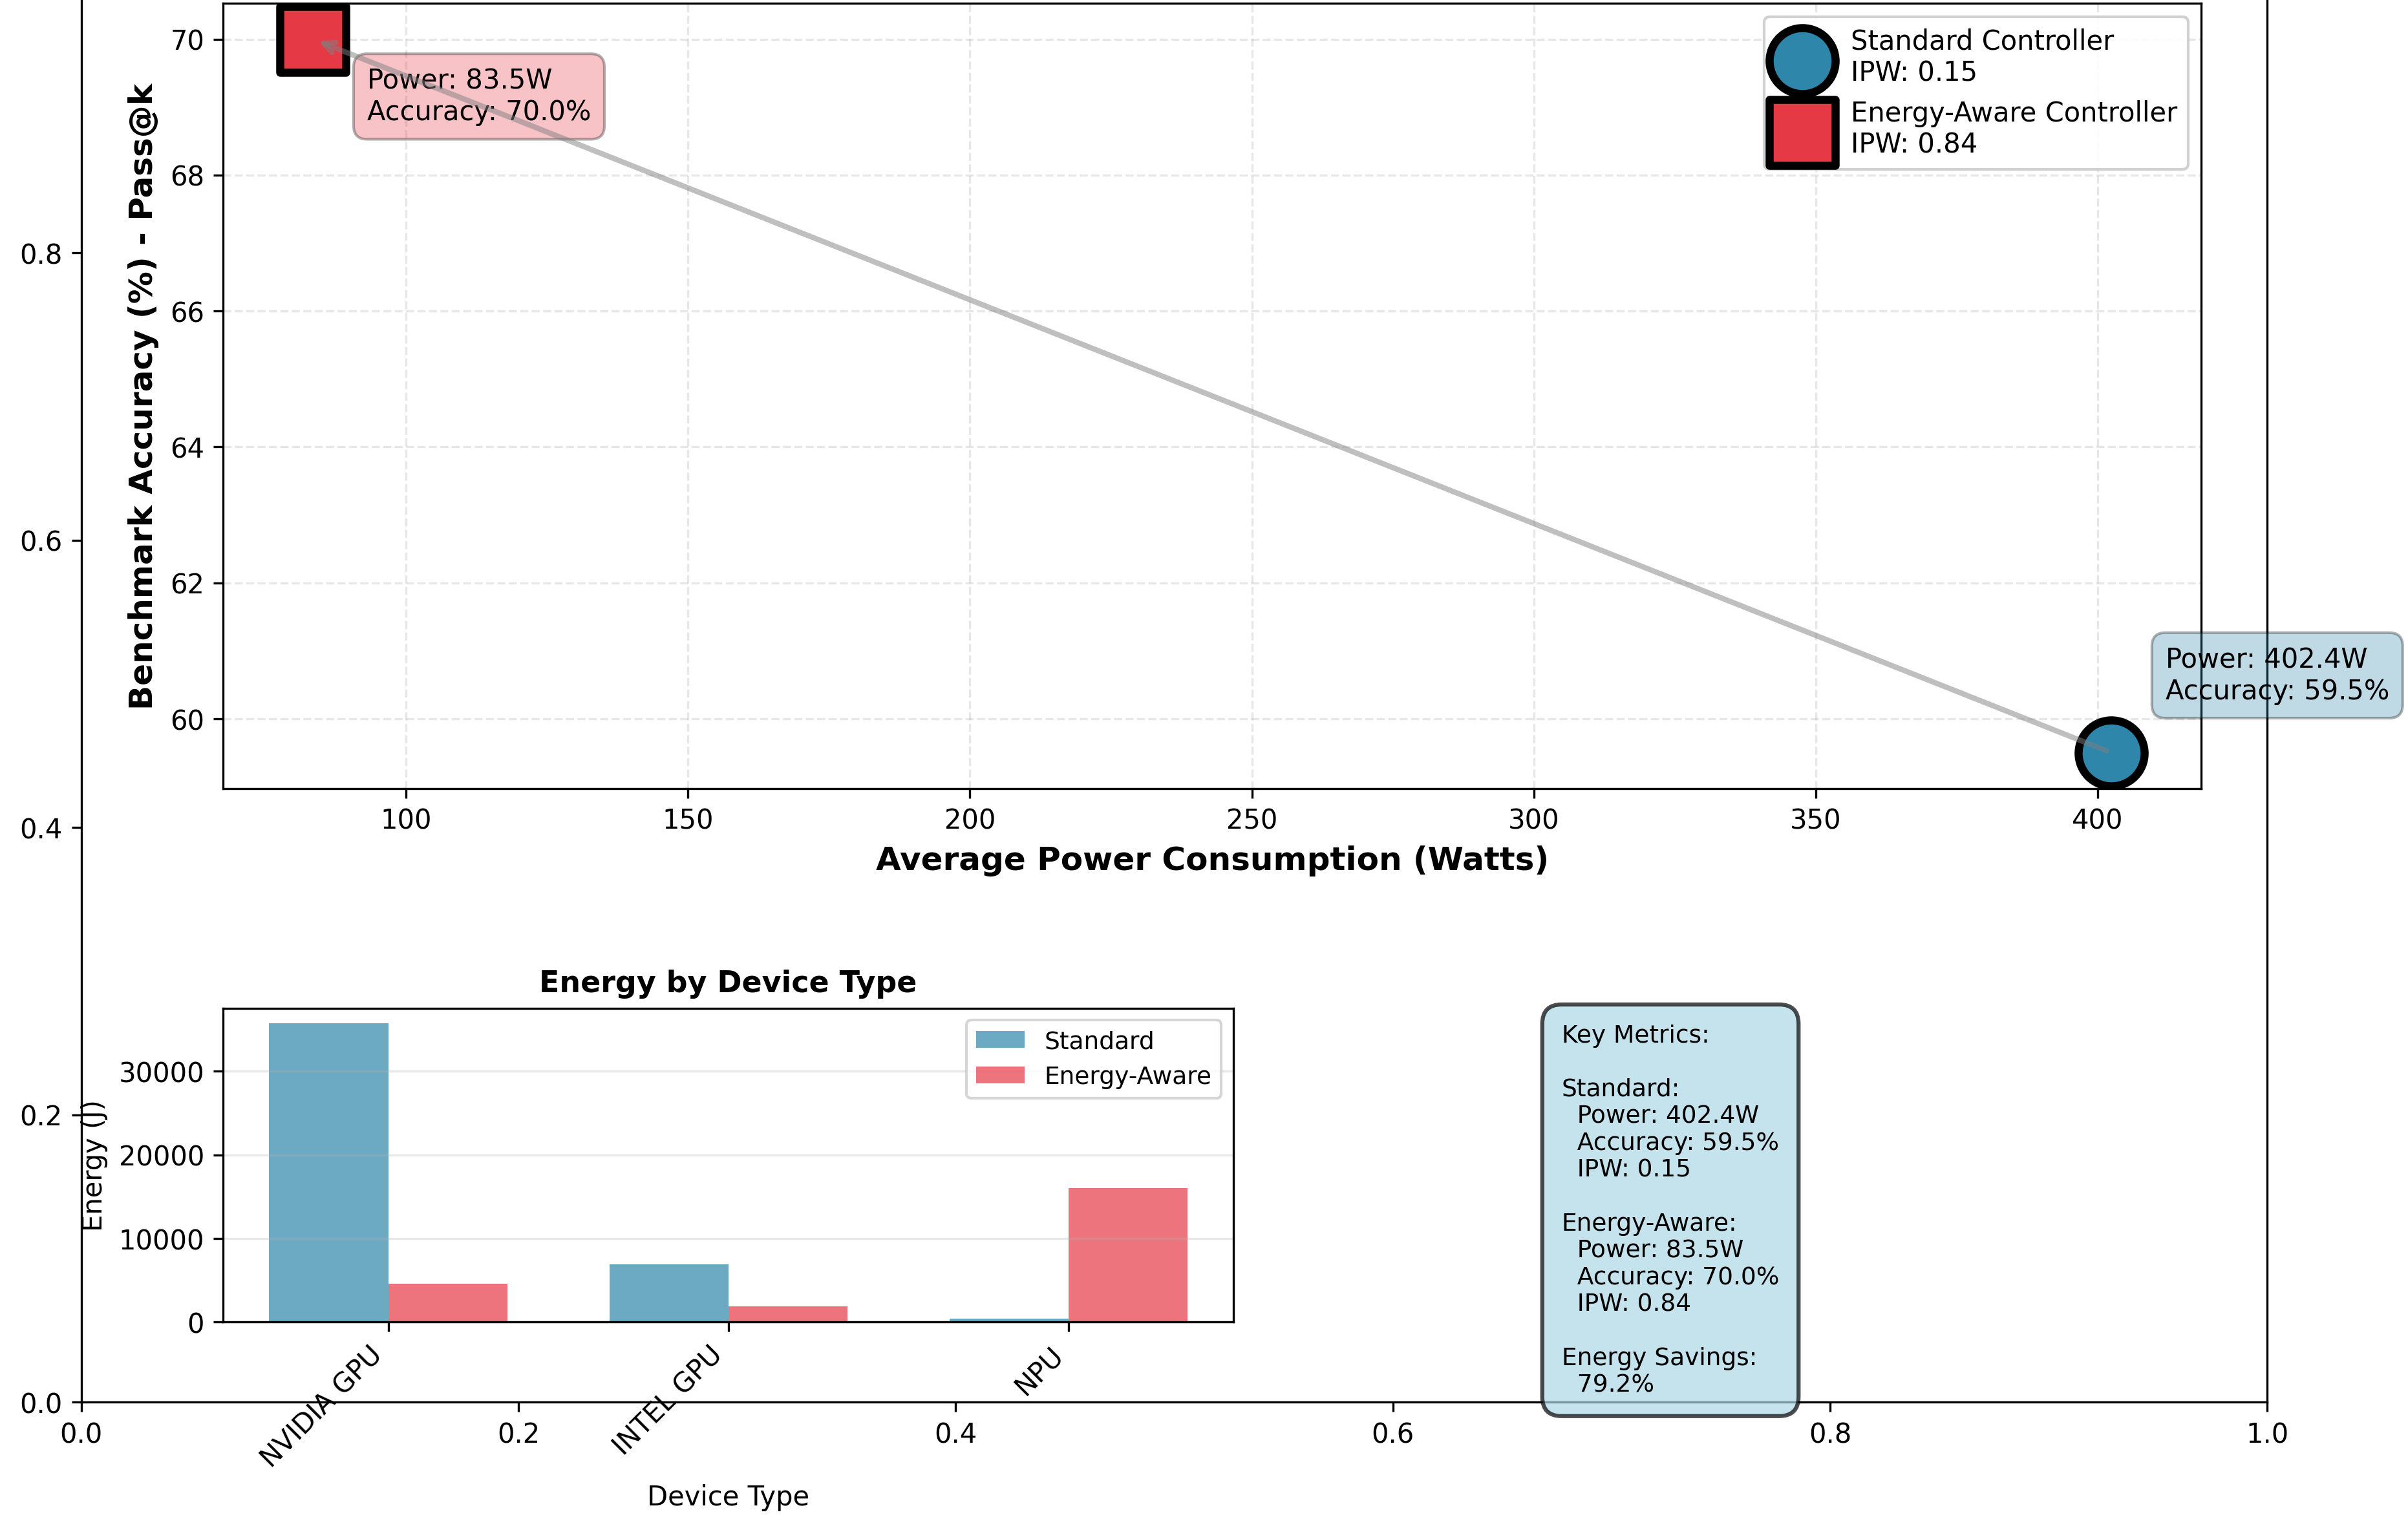
The image is a composite technical figure containing two primary charts and a summary text box. The main chart is a scatter plot comparing the performance of two system controllers ("Standard" and "Energy-Aware") across two metrics: power consumption and benchmark accuracy. Below it is a bar chart breaking down energy consumption by device type for each controller. A text box on the right summarizes key metrics. The overall purpose is to demonstrate the trade-offs and benefits of an "Energy-Aware Controller" compared to a "Standard Controller."
### Components/Axes
**Main Scatter Plot (Top):**
* **X-Axis:** "Average Power Consumption (Watts)". Scale ranges from approximately 80 to 420 Watts.
* **Y-Axis:** "Benchmark Accuracy (%) - Pass@k". Scale ranges from 0.4 (40%) to 0.7 (70%).
* **Legend (Top-Right):**
* Blue Circle: "Standard Controller", with sub-label "IPW: 0.15".
* Red Square: "Energy-Aware Controller", with sub-label "IPW: 0.84".
* **Data Points:**
1. **Standard Controller (Blue Circle):** Positioned at approximately (402.4, 0.595). An attached label reads: "Power: 402.4W, Accuracy: 59.5%".
2. **Energy-Aware Controller (Red Square):** Positioned at approximately (83.5, 0.700). An attached label reads: "Power: 83.5W, Accuracy: 70.0%".
* **Trend Line:** A solid gray line connects the two data points, sloping downward from left to right.
**Inset Bar Chart (Bottom-Left):**
* **Title:** "Energy by Device Type".
* **X-Axis:** "Device Type". Categories are "NVIDIA GPU", "INTEL GPU", and "NPU".
* **Y-Axis:** "Energy (J)". Scale ranges from 0 to over 30,000 Joules.
* **Legend (Within chart, top-right):**
* Blue Bar: "Standard".
* Red Bar: "Energy-Aware".
* **Data Bars (Approximate Values):**
* **NVIDIA GPU:** Standard ~35,000 J; Energy-Aware ~5,000 J.
* **INTEL GPU:** Standard ~7,000 J; Energy-Aware ~2,000 J.
* **NPU:** Standard ~500 J; Energy-Aware ~16,000 J.
**Key Metrics Text Box (Bottom-Right):**
* A light blue box containing the following text:
```
Key Metrics:
Standard:
Power: 402.4W
Accuracy: 59.5%
IPW: 0.15
Energy-Aware:
Power: 83.5W
Accuracy: 70.0%
IPW: 0.84
Energy Savings:
79.2%
```
### Detailed Analysis
**Trend Verification:**
* The gray line connecting the two controller points shows a clear negative correlation: as average power consumption increases, benchmark accuracy decreases.
* The **Standard Controller** (blue circle) is positioned at the high-power, lower-accuracy end of this trend.
* The **Energy-Aware Controller** (red square) is positioned at the low-power, higher-accuracy end, indicating it breaks the expected trade-off by improving both metrics simultaneously.
**Component Isolation - Bar Chart Analysis:**
* The bar chart reveals that the energy profile varies dramatically by device type.
* For the **NVIDIA GPU** and **INTEL GPU**, the "Standard" controller consumes significantly more energy than the "Energy-Aware" controller.
* For the **NPU**, the relationship is inverted: the "Energy-Aware" controller consumes vastly more energy (~16,000 J) than the "Standard" controller (~500 J). This is a critical outlier.
### Key Observations
1. **Performance Reversal:** The Energy-Aware Controller achieves higher accuracy (70.0% vs. 59.5%) while using dramatically less power (83.5W vs. 402.4W).
2. **Massive Energy Savings:** The stated "Energy Savings: 79.2%" is primarily driven by the enormous reduction in energy use on the NVIDIA GPU.
3. **NPU Anomaly:** The NPU shows a complete reversal of the energy-saving trend. The Energy-Aware Controller uses over 30 times more energy on this device type compared to the Standard Controller.
4. **IPW Metric:** The "IPW" value is much higher for the Energy-Aware Controller (0.84) than the Standard Controller (0.15). Without a definition, this likely represents an "Inverse Power Weight" or similar efficiency metric where higher is better.
### Interpretation
This figure presents a compelling case for the adoption of the "Energy-Aware Controller." The data suggests it is not merely a power-saving mode that sacrifices performance, but a superior optimization strategy that improves both energy efficiency and computational accuracy for the given benchmark (Pass@k).
The **scatter plot** visually argues that the controller successfully navigates the power-accuracy Pareto frontier, moving to a more optimal point. The **bar chart** provides crucial granularity, showing that the savings are not uniform. The controller appears to intelligently reallocate computational effort: it drastically reduces energy use on powerful, general-purpose GPUs (NVIDIA, Intel) while significantly increasing energy use on specialized NPUs. This implies the controller is offloading work to the more efficient NPU for certain tasks, which explains both the overall energy savings and the improved accuracy. The outlier on the NPU is not a flaw but evidence of this strategic reallocation.
The **Key Metrics** box consolidates the headline results, emphasizing the 79.2% energy savings as the primary takeaway. The inclusion of the IPW metric, though undefined, serves as a single-number summary of the controller's superior efficiency. In summary, the image communicates that the Energy-Aware Controller is a smarter system that understands device-specific capabilities to optimize for both performance and power.