## Line Chart: Benchmark Accuracy vs. Power Consumption
### Overview
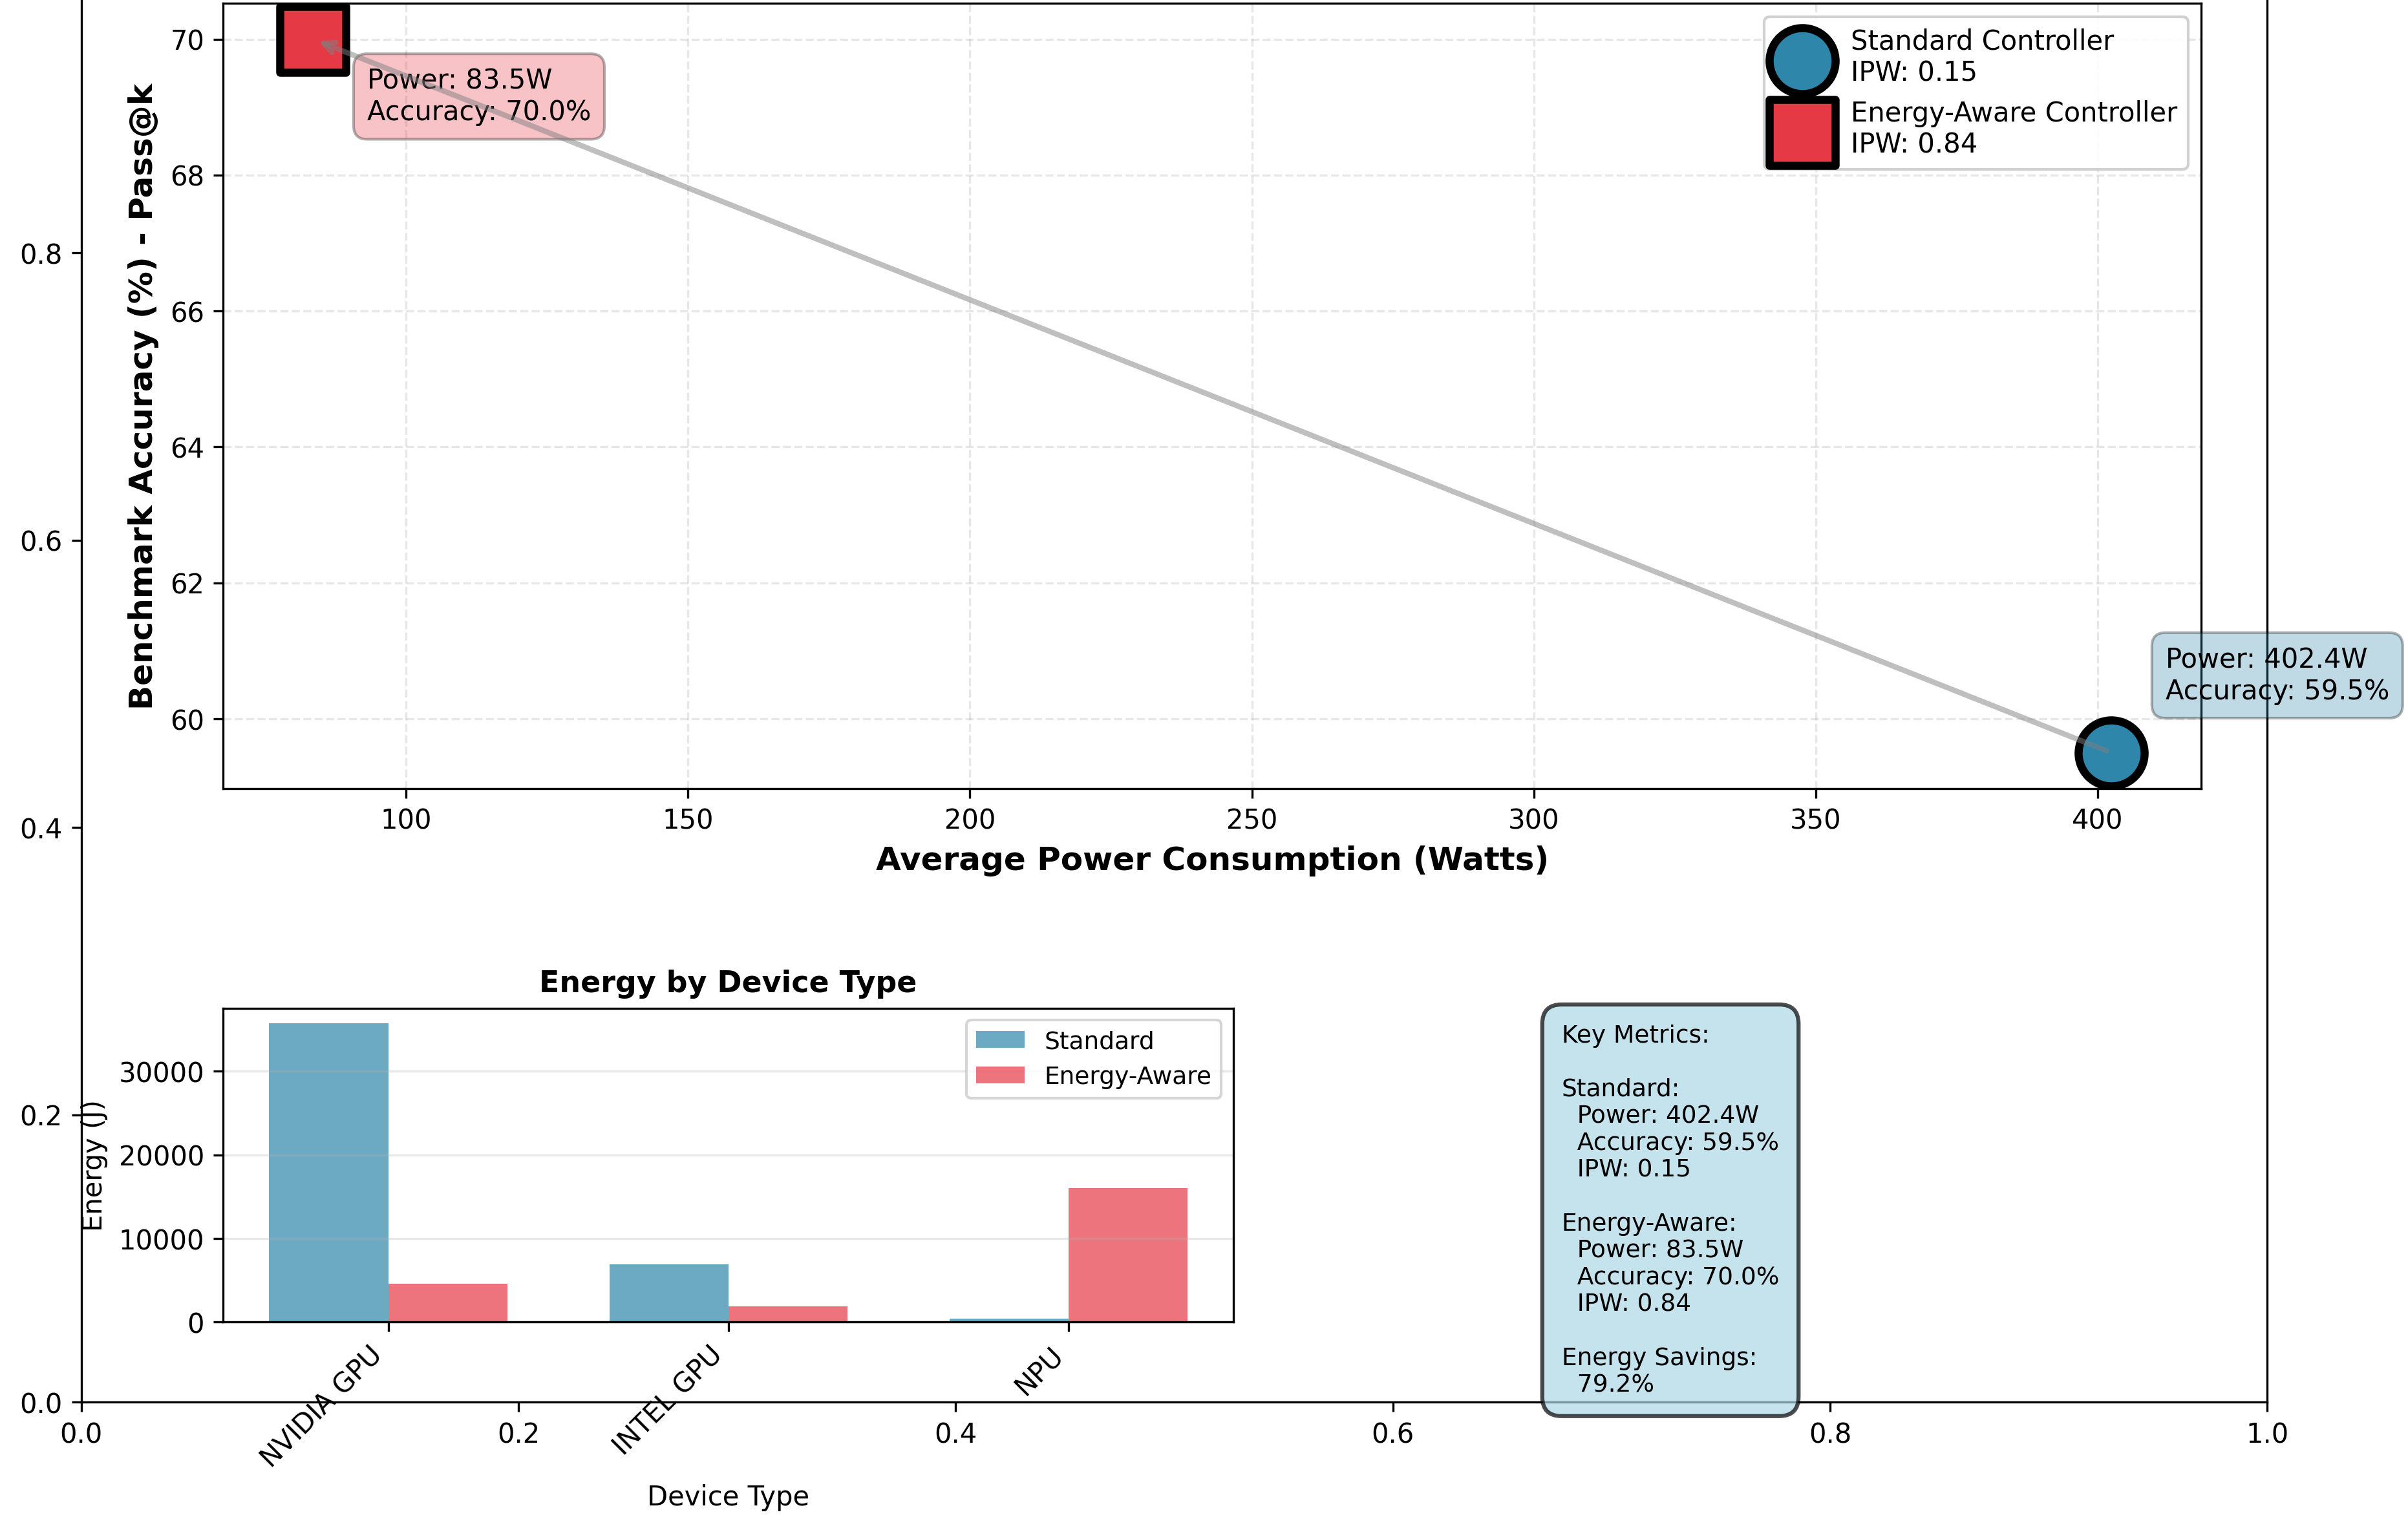
A line chart comparing the relationship between average power consumption (Watts) and benchmark accuracy (%) for two controllers: Standard Controller and Energy-Aware Controller. The chart includes a downward-sloping trendline and two annotated data points.
### Components/Axes
- **X-axis**: Average Power Consumption (Watts), ranging from 100 to 400.
- **Y-axis**: Benchmark Accuracy (%), ranging from 59.5% to 70%.
- **Legend**:
- Blue circle: Standard Controller (IPW: 0.15).
- Red square: Energy-Aware Controller (IPW: 0.84).
- **Text Box**: Contains key metrics (power, accuracy, energy savings) for both controllers.
### Detailed Analysis
- **Standard Controller**:
- Power: 402.4W (annotated at x=400).
- Accuracy: 59.5% (annotated at y=60).
- **Energy-Aware Controller**:
- Power: 83.5W (annotated at x=100).
- Accuracy: 70.0% (annotated at y=70).
- **Trendline**: A straight line connects the two data points, sloping downward from left (Energy-Aware) to right (Standard).
### Key Observations
1. The Energy-Aware Controller consumes significantly less power (83.5W vs. 402.4W) while achieving higher accuracy (70.0% vs. 59.5%).
2. The trendline visually reinforces the inverse relationship between power consumption and accuracy for the Standard Controller.
### Interpretation
The Energy-Aware Controller demonstrates superior efficiency, achieving 79.2% energy savings while maintaining higher accuracy. This suggests it optimizes resource allocation, reducing unnecessary power usage without compromising performance. The Standard Controller’s higher power consumption correlates with lower accuracy, indicating inefficiency in resource management.
---
## Bar Chart: Energy Consumption by Device Type
### Overview
A grouped bar chart comparing energy consumption (kJ) for three device types (NVIDIA GPU, Intel GPU, NPU) between Standard and Energy-Aware Controllers.
### Components/Axes
- **X-axis**: Device Type (NVIDIA GPU, Intel GPU, NPU).
- **Y-axis**: Energy (kJ), ranging from 0 to 35,000.
- **Legend**:
- Blue bars: Standard Controller.
- Red bars: Energy-Aware Controller.
### Detailed Analysis
- **NVIDIA GPU**:
- Standard: ~35,000 kJ.
- Energy-Aware: ~5,000 kJ.
- **Intel GPU**:
- Standard: ~8,000 kJ.
- Energy-Aware: ~2,000 kJ.
- **NPU**:
- Standard: ~1,000 kJ.
- Energy-Aware: ~15,000 kJ.
### Key Observations
1. The Energy-Aware Controller reduces energy consumption by ~85% for NVIDIA and Intel GPUs.
2. For NPUs, the Energy-Aware Controller consumes 15x more energy than the Standard Controller, suggesting a trade-off in NPU workloads.
### Interpretation
The Energy-Aware Controller significantly lowers energy use for GPU-based tasks but may prioritize performance over efficiency for NPUs. This aligns with the line chart’s findings, where the controller excels in power-constrained scenarios (e.g., GPU workloads) but adapts differently for NPU tasks.
---
## Key Metrics Text Box
**Standard**:
- Power: 402.4W
- Accuracy: 59.5%
- IPW: 0.15
**Energy-Aware**:
- Power: 83.5W
- Accuracy: 70.0%
- IPW: 0.84
**Energy Savings**: 79.2%
### Language Note
All text is in English. No non-English content detected.
---
## Spatial Grounding
- **Line Chart**: Top section, with legend in the top-right corner.
- **Bar Chart**: Bottom section, aligned with the line chart’s x-axis scale.
- **Text Box**: Right-aligned, overlapping both charts.
## Trend Verification
- **Line Chart**: Confirmed downward slope matches the annotated data points.
- **Bar Chart**: Energy-Aware bars are consistently shorter (except NPU), validating energy savings.
## Component Isolation
1. **Header**: Line chart title and axes.
2. **Main Chart**: Line and bar charts with legends.
3. **Footer**: Key metrics text box.
## Final Notes
The charts collectively highlight the Energy-Aware Controller’s efficiency in GPU workloads but raise questions about its NPU strategy. Further analysis could explore workload-specific optimizations.