## Scatter Plot: KL Divergence vs. $\tau$ for 5-state Adder
### Overview
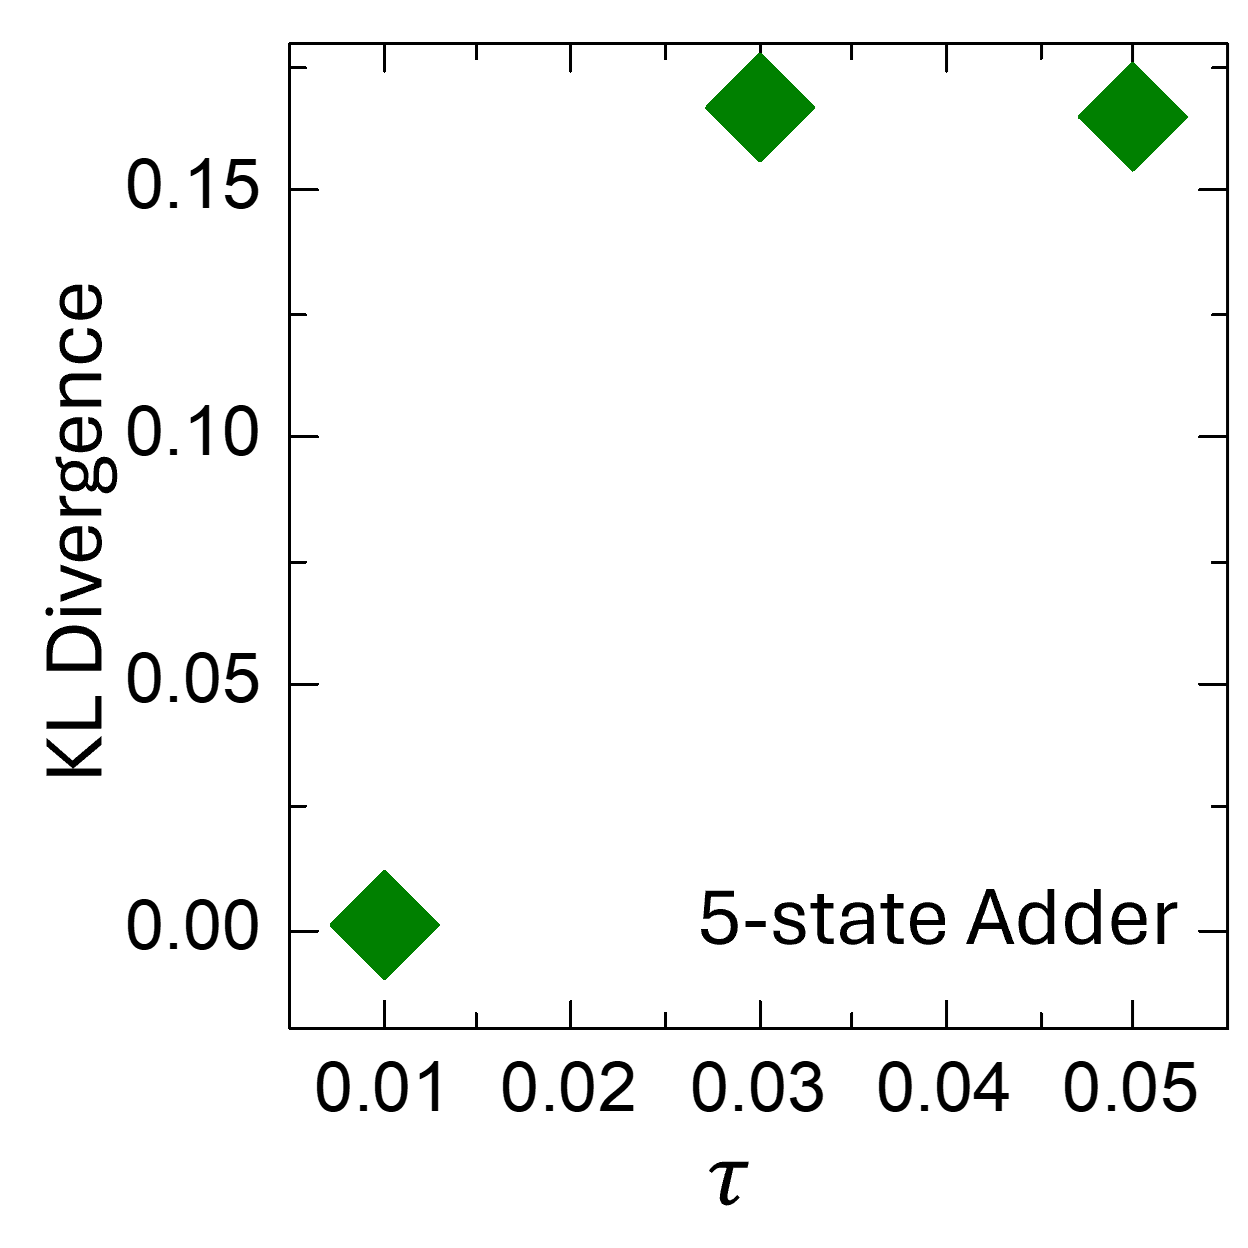
This image is a scatter plot illustrating the relationship between a parameter $\tau$ (tau) and "KL Divergence" for a system identified as a "5-state Adder." The plot contains three distinct data points represented by green diamonds.
### Components/Axes
* **Y-Axis:** Labeled "KL Divergence." The scale ranges from 0.00 to 0.15, with major tick marks at 0.00, 0.05, 0.10, and 0.15.
* **X-Axis:** Labeled "$\tau$." The scale ranges from 0.01 to 0.05, with major tick marks at 0.01, 0.02, 0.03, 0.04, and 0.05.
* **Data Markers:** Three large, solid green diamond-shaped markers.
* **Text Label:** "5-state Adder" is positioned in the bottom-right quadrant of the plot area.
### Detailed Analysis
The data series consists of three points. The visual trend shows a sharp increase in KL Divergence between $\tau = 0.01$ and $\tau = 0.03$, followed by a plateau between $\tau = 0.03$ and $\tau = 0.05$.
* **Point 1 (Bottom-Left):**
* **Position:** X-axis value of 0.01, Y-axis value of 0.00.
* **Status:** The marker is centered exactly on the intersection of the 0.01 X-axis tick and the 0.00 Y-axis tick.
* **Point 2 (Top-Middle):**
* **Position:** X-axis value of 0.03, Y-axis value of approximately 0.17.
* **Status:** The marker is centered above the 0.03 X-axis tick. Vertically, it sits above the 0.15 Y-axis tick mark.
* **Point 3 (Top-Right):**
* **Position:** X-axis value of 0.05, Y-axis value of approximately 0.17.
* **Status:** The marker is centered above the 0.05 X-axis tick. It is horizontally aligned with Point 2, indicating the same Y-axis value.
### Key Observations
* **Threshold Effect:** The system exhibits a distinct threshold behavior. At $\tau = 0.01$, the KL Divergence is zero, indicating perfect alignment or convergence.
* **Saturation:** The KL Divergence increases significantly as $\tau$ moves from 0.01 to 0.03, but then remains constant (plateaus) as $\tau$ increases further to 0.05.
* **Data Sparsity:** The plot only provides data for three specific values of $\tau$ (0.01, 0.03, 0.05), leaving the behavior between these points undefined.
### Interpretation
The data demonstrates that the "5-state Adder" system is sensitive to the parameter $\tau$.
* **KL Divergence Significance:** KL Divergence (Kullback-Leibler divergence) is a measure of how one probability distribution differs from a reference distribution. A value of 0.00 at $\tau = 0.01$ suggests that at this specific parameter value, the system's output distribution perfectly matches the target distribution.
* **System Instability:** The sharp rise in divergence at $\tau = 0.03$ suggests that increasing $\tau$ beyond 0.01 introduces significant error or deviation in the system's state distribution.
* **Steady State Error:** The plateau at $\tau = 0.03$ and $\tau = 0.05$ suggests that once the system deviates from the target distribution, it reaches a maximum level of divergence (approximately 0.17) within this parameter range. It does not appear to diverge further as $\tau$ increases from 0.03 to 0.05, implying the system reaches a stable, albeit inaccurate, state.