## Chart: KL Divergence vs. τ for 5-state Adder
### Overview
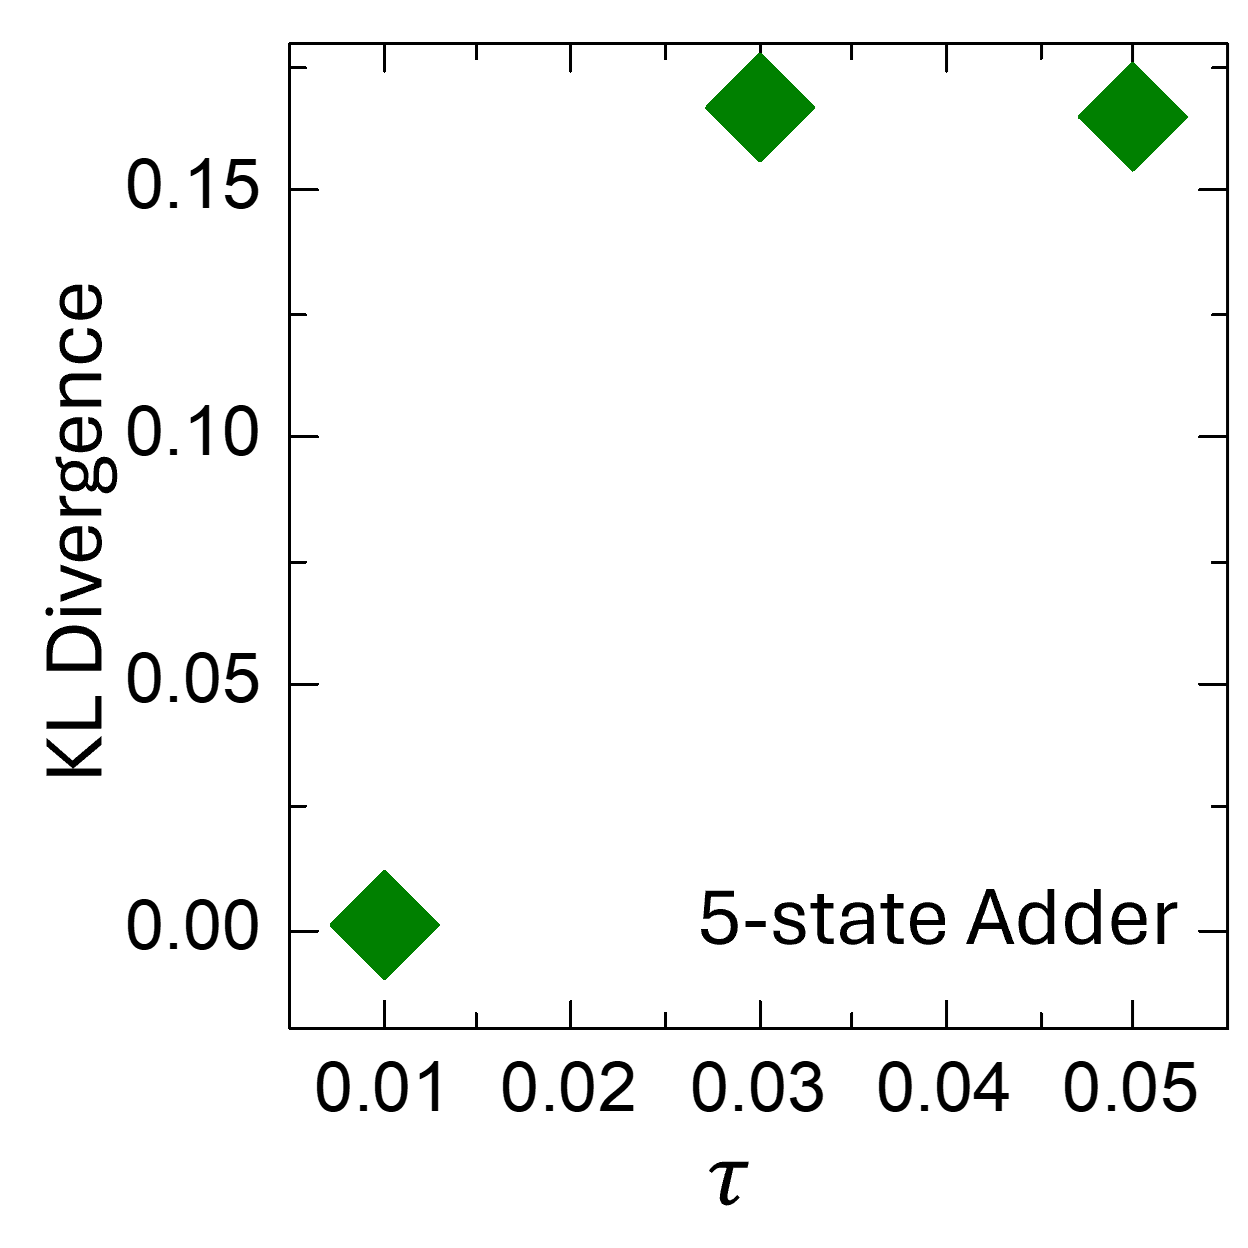
The image is a scatter plot showing the relationship between KL Divergence and τ for a 5-state Adder. The plot contains three data points, all represented by green diamonds. The KL Divergence appears to increase sharply from τ = 0.01 to τ = 0.03, then plateaus or slightly decreases at τ = 0.05.
### Components/Axes
* **X-axis (Horizontal):** τ, with tick marks at 0.01, 0.02, 0.03, 0.04, and 0.05.
* **Y-axis (Vertical):** KL Divergence, with tick marks at 0.00, 0.05, 0.10, and 0.15.
* **Data Points:** Three green diamond markers.
* **Text Label:** "5-state Adder" is located near the bottom-right of the plot.
### Detailed Analysis
* **Data Point 1:** Located at approximately (τ = 0.01, KL Divergence = 0.00). The marker is a green diamond.
* **Data Point 2:** Located at approximately (τ = 0.03, KL Divergence = 0.165). The marker is a green diamond.
* **Data Point 3:** Located at approximately (τ = 0.05, KL Divergence = 0.16). The marker is a green diamond.
### Key Observations
* The KL Divergence increases significantly between τ = 0.01 and τ = 0.03.
* The KL Divergence plateaus or slightly decreases between τ = 0.03 and τ = 0.05.
* There are only three data points in the plot.
### Interpretation
The plot suggests that for the 5-state Adder, the KL Divergence is highly sensitive to changes in τ at lower values (around 0.01 to 0.03). As τ increases beyond 0.03, the KL Divergence stabilizes, indicating a potential saturation point or diminishing returns in terms of divergence. The limited number of data points makes it difficult to draw definitive conclusions about the overall trend, but it highlights a region of interest for further investigation around τ = 0.01 to 0.05.