\n
## Scatter Plot: KL Divergence vs. Tau for 5-state Adder
### Overview
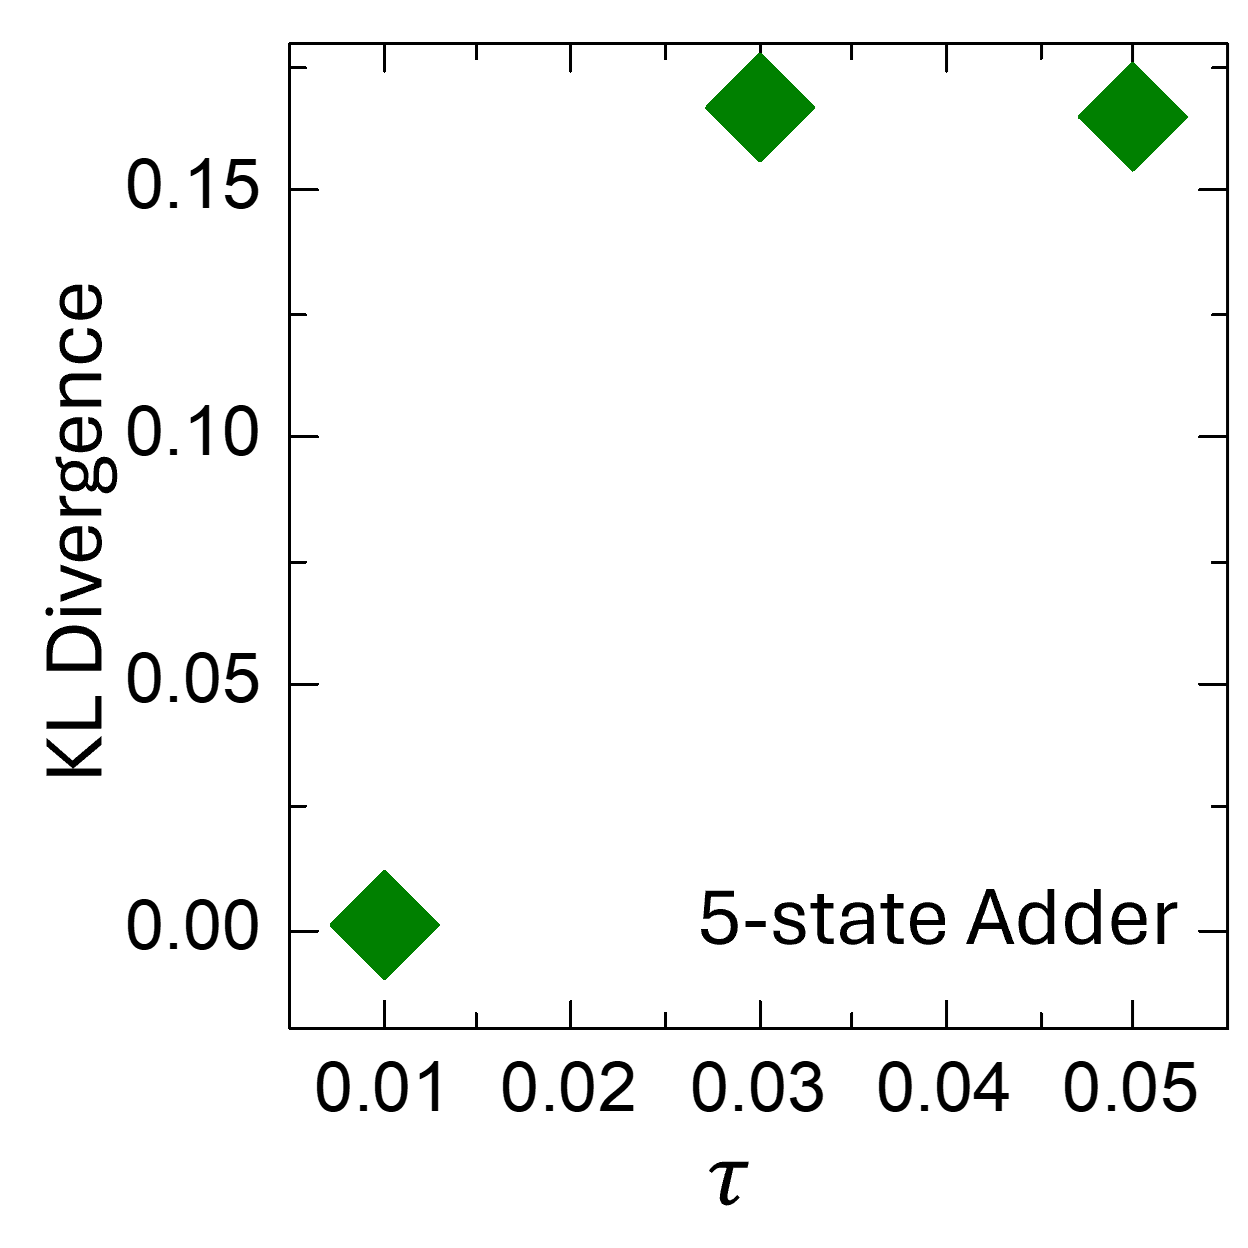
This image presents a scatter plot illustrating the relationship between KL Divergence and a parameter denoted as 'τ' (tau) for a "5-state Adder". The plot displays three data points, each represented by a green diamond marker.
### Components/Axes
* **X-axis:** Labeled "τ" (tau). The scale ranges from approximately 0.00 to 0.06, with tick marks at 0.01, 0.02, 0.03, 0.04, and 0.05.
* **Y-axis:** Labeled "KL Divergence". The scale ranges from approximately -0.02 to 0.16, with tick marks at 0.00, 0.05, 0.10, and 0.15.
* **Title/Label:** "5-state Adder" is positioned in the bottom-right corner of the plot area.
* **Data Markers:** Green diamond shapes represent individual data points.
### Detailed Analysis
The plot contains three data points:
1. **Point 1:** Located at approximately τ = 0.01 and KL Divergence = 0.00.
2. **Point 2:** Located at approximately τ = 0.03 and KL Divergence = 0.16.
3. **Point 3:** Located at approximately τ = 0.05 and KL Divergence = 0.16.
The data points show a non-linear relationship. KL Divergence remains at approximately 0.00 for τ = 0.01, then rapidly increases to approximately 0.16 for τ = 0.03 and remains constant at 0.16 for τ = 0.05.
### Key Observations
* The KL Divergence is minimal at the lowest value of τ (0.01).
* There is a significant jump in KL Divergence between τ = 0.01 and τ = 0.03.
* KL Divergence plateaus at approximately 0.16 for τ values of 0.03 and 0.05.
* The data is sparse, with only three points, making it difficult to determine the exact nature of the relationship.
### Interpretation
The plot suggests that the KL Divergence, a measure of how one probability distribution differs from a reference probability distribution, is sensitive to changes in the parameter τ for the 5-state adder. Initially, small changes in τ do not significantly affect the KL Divergence. However, beyond a certain threshold (around τ = 0.03), further increases in τ do not lead to further increases in KL Divergence, indicating a saturation point.
This could imply that the 5-state adder's behavior changes significantly around τ = 0.03. Below this value, the system operates in a regime where the probability distribution is relatively stable. Above this value, the system reaches a state where further adjustments to τ do not alter the probability distribution significantly. The high KL Divergence values suggest a substantial difference between the probability distribution at τ = 0.03 and 0.05 and the reference distribution (presumably at τ = 0.01).
Further investigation with more data points would be needed to fully characterize the relationship and understand the underlying reasons for this behavior. The choice of KL Divergence as the metric suggests an interest in quantifying the information loss or difference in distributions as τ is varied.