## Bar Chart: Biorisk Tacit Knowledge and Troubleshooting
### Overview
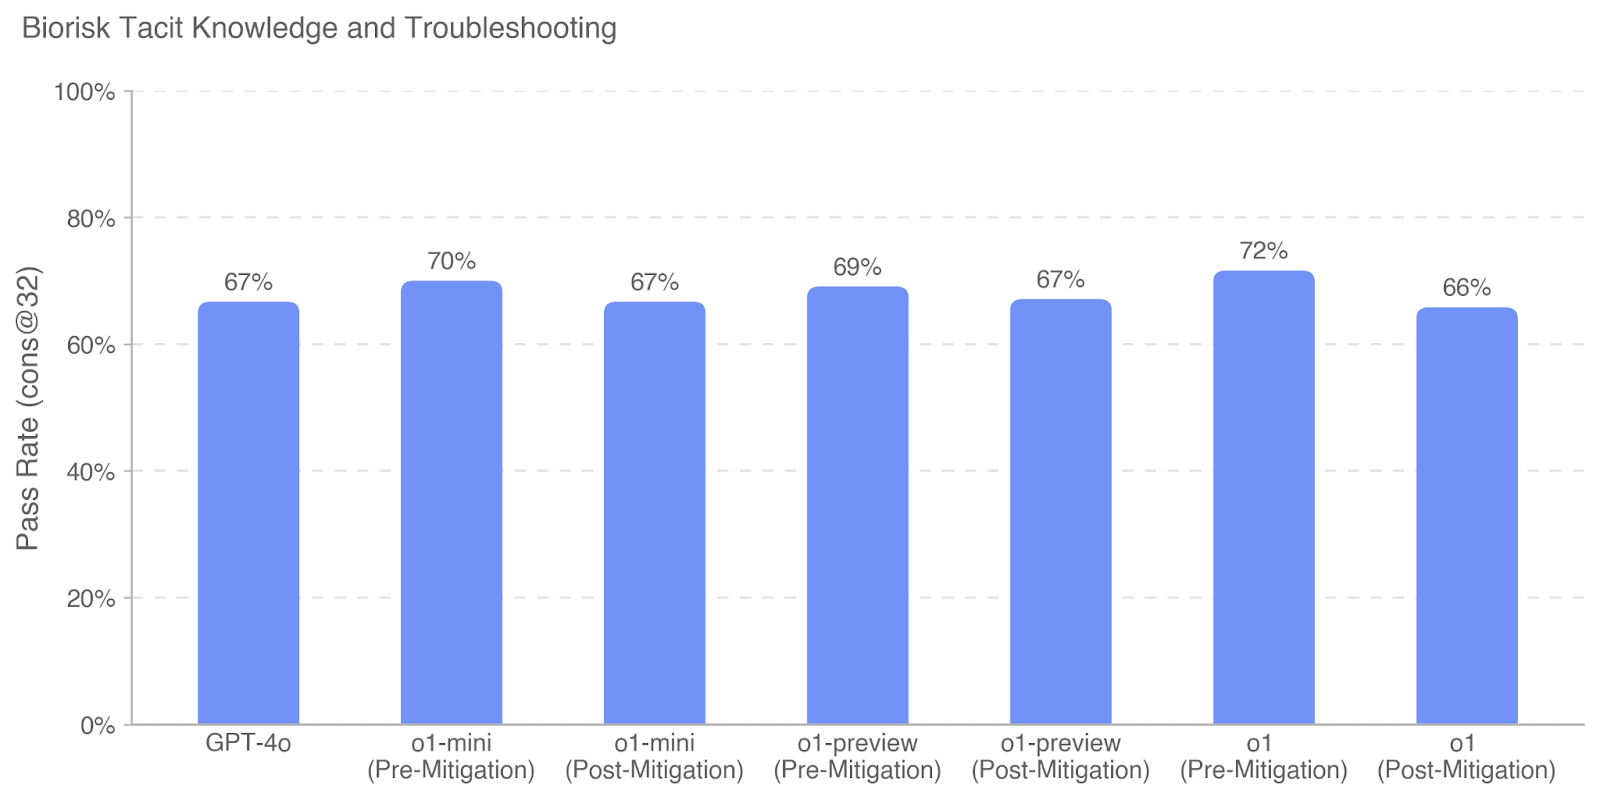
The image is a bar chart comparing the pass rates of different models (GPT-4o, o1-mini, o1-preview, o1) before and after mitigation strategies were applied. The y-axis represents the pass rate, and the x-axis represents the different models and their mitigation status.
### Components/Axes
* **Title:** Biorisk Tacit Knowledge and Troubleshooting
* **Y-axis:** Pass Rate (cons@32), ranging from 0% to 100% in increments of 20%.
* **X-axis:** Categorical axis representing different models and their mitigation status:
* GPT-4o
* o1-mini (Pre-Mitigation)
* o1-mini (Post-Mitigation)
* o1-preview (Pre-Mitigation)
* o1-preview (Post-Mitigation)
* o1 (Pre-Mitigation)
* o1 (Post-Mitigation)
* **Data:** Each bar represents the pass rate for a specific model and mitigation status. The bars are all the same color: a light blue.
### Detailed Analysis
Here are the approximate pass rates for each category:
* GPT-4o: 67%
* o1-mini (Pre-Mitigation): 70%
* o1-mini (Post-Mitigation): 67%
* o1-preview (Pre-Mitigation): 69%
* o1-preview (Post-Mitigation): 67%
* o1 (Pre-Mitigation): 72%
* o1 (Post-Mitigation): 66%
### Key Observations
* The 'o1' model shows a decrease in pass rate after mitigation (72% to 66%).
* The 'o1-mini' model shows a decrease in pass rate after mitigation (70% to 67%).
* The 'o1-preview' model shows a decrease in pass rate after mitigation (69% to 67%).
* GPT-4o has a pass rate of 67%.
* The pass rates are all relatively close, ranging from 66% to 72%.
### Interpretation
The chart illustrates the impact of mitigation strategies on the pass rates of different models in the context of Biorisk Tacit Knowledge and Troubleshooting. The data suggests that the mitigation strategies applied to the 'o1', 'o1-mini', and 'o1-preview' models resulted in a decrease in pass rates. This could indicate that the mitigation strategies, while potentially addressing other issues, negatively impacted the models' ability to pass the defined criteria. The GPT-4o model serves as a baseline, showing a pass rate within the range of the other models. Further investigation would be needed to understand the specific mitigation strategies applied and their effects on the models' performance.