\n
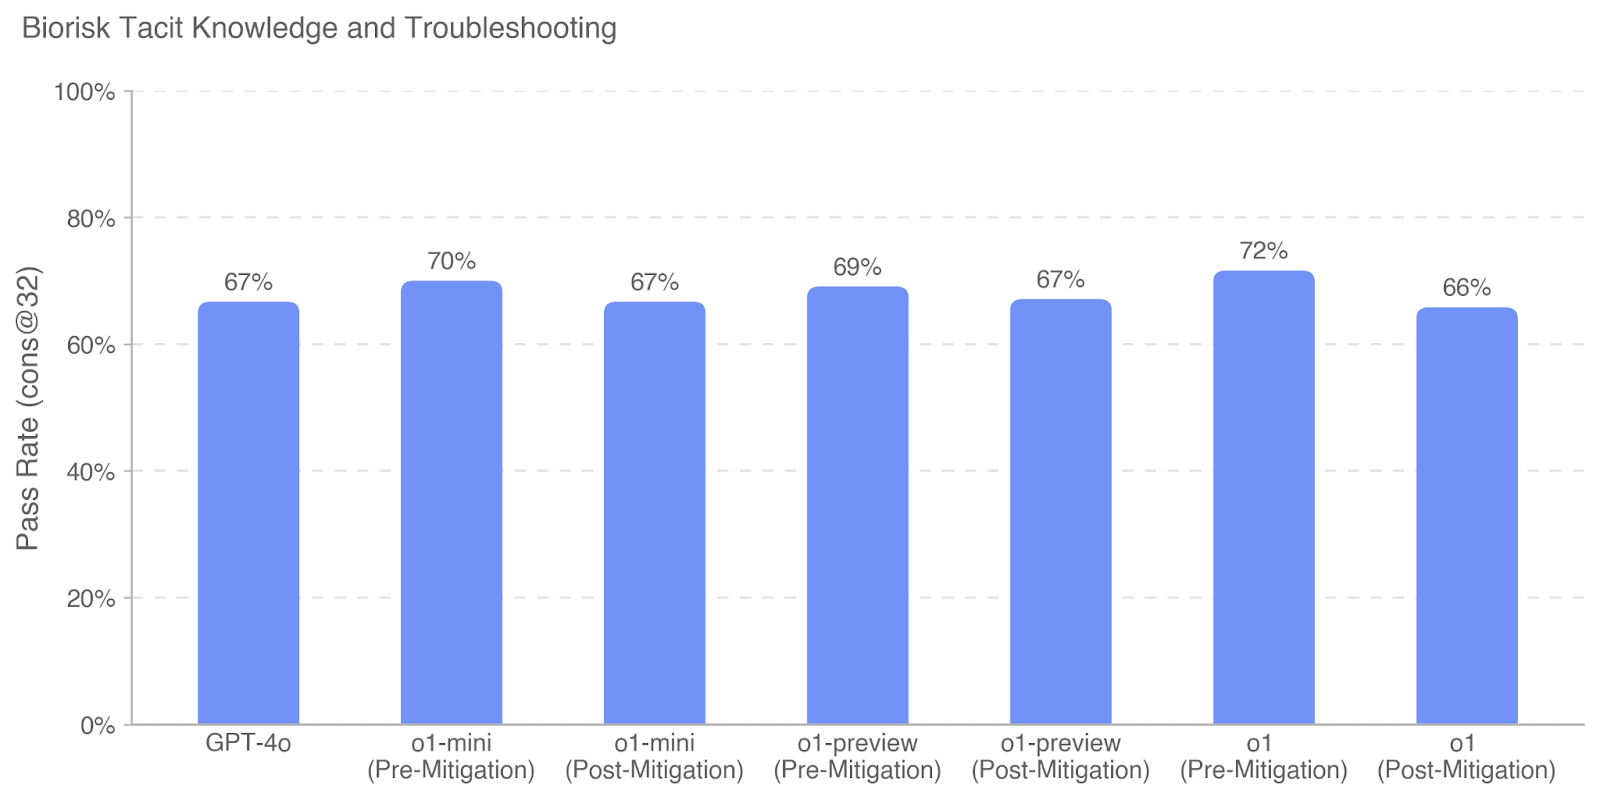
## Bar Chart: Biorisk Tacit Knowledge and Troubleshooting
### Overview
This bar chart displays the "Pass Rate (cons@32)" for different models/stages of a biorisk troubleshooting process. The x-axis represents the model or stage, and the y-axis represents the pass rate as a percentage. The chart compares performance "Pre-Mitigation" and "Post-Mitigation" for several models.
### Components/Axes
* **Title:** Biorisk Tacit Knowledge and Troubleshooting
* **X-axis:** Model/Stage (Categorical)
* GPT-4o
* o1-mini (Pre-Mitigation)
* o1-mini (Post-Mitigation)
* o1-preview (Pre-Mitigation)
* o1-preview (Post-Mitigation)
* o1 (Pre-Mitigation)
* o1 (Post-Mitigation)
* **Y-axis:** Pass Rate (cons@32) - Scale from 0% to 100% with increments of 20%.
### Detailed Analysis
The chart consists of seven vertical bars, each representing the pass rate for a specific model or stage.
* **GPT-4o:** The bar reaches approximately 67% pass rate.
* **o1-mini (Pre-Mitigation):** The bar reaches approximately 70% pass rate.
* **o1-mini (Post-Mitigation):** The bar reaches approximately 67% pass rate.
* **o1-preview (Pre-Mitigation):** The bar reaches approximately 69% pass rate.
* **o1-preview (Post-Mitigation):** The bar reaches approximately 67% pass rate.
* **o1 (Pre-Mitigation):** The bar reaches approximately 72% pass rate.
* **o1 (Post-Mitigation):** The bar reaches approximately 66% pass rate.
The bars for each model are paired to show the difference between "Pre-Mitigation" and "Post-Mitigation" performance.
### Key Observations
* GPT-4o has a pass rate of 67%.
* The "o1" model shows the highest "Pre-Mitigation" pass rate at approximately 72%.
* The "o1" model shows the lowest "Post-Mitigation" pass rate at approximately 66%.
* The "o1-mini" and "o1-preview" models show similar pass rates, with "Pre-Mitigation" slightly higher than "Post-Mitigation".
* In general, the "Pre-Mitigation" pass rates are slightly higher than the "Post-Mitigation" pass rates for the "o1-mini", "o1-preview", and "o1" models.
### Interpretation
The data suggests that the mitigation strategies applied to the "o1-mini", "o1-preview", and "o1" models slightly decrease their pass rates. This could indicate that the mitigation process introduces new challenges or errors, or that the initial performance was somewhat inflated. GPT-4o's performance remains consistent regardless of mitigation. The highest pre-mitigation performance is observed in the "o1" model, but it also experiences the largest drop in performance post-mitigation. This suggests that the "o1" model may be more sensitive to the mitigation process. The chart highlights the importance of carefully evaluating the impact of mitigation strategies on model performance. It also suggests that GPT-4o is a more robust model, less affected by the mitigation process. Further investigation is needed to understand why the mitigation strategies are reducing performance in some cases and to optimize the mitigation process for better results.