## Bar Chart: Biorisk Tacit Knowledge and Troubleshooting
### Overview
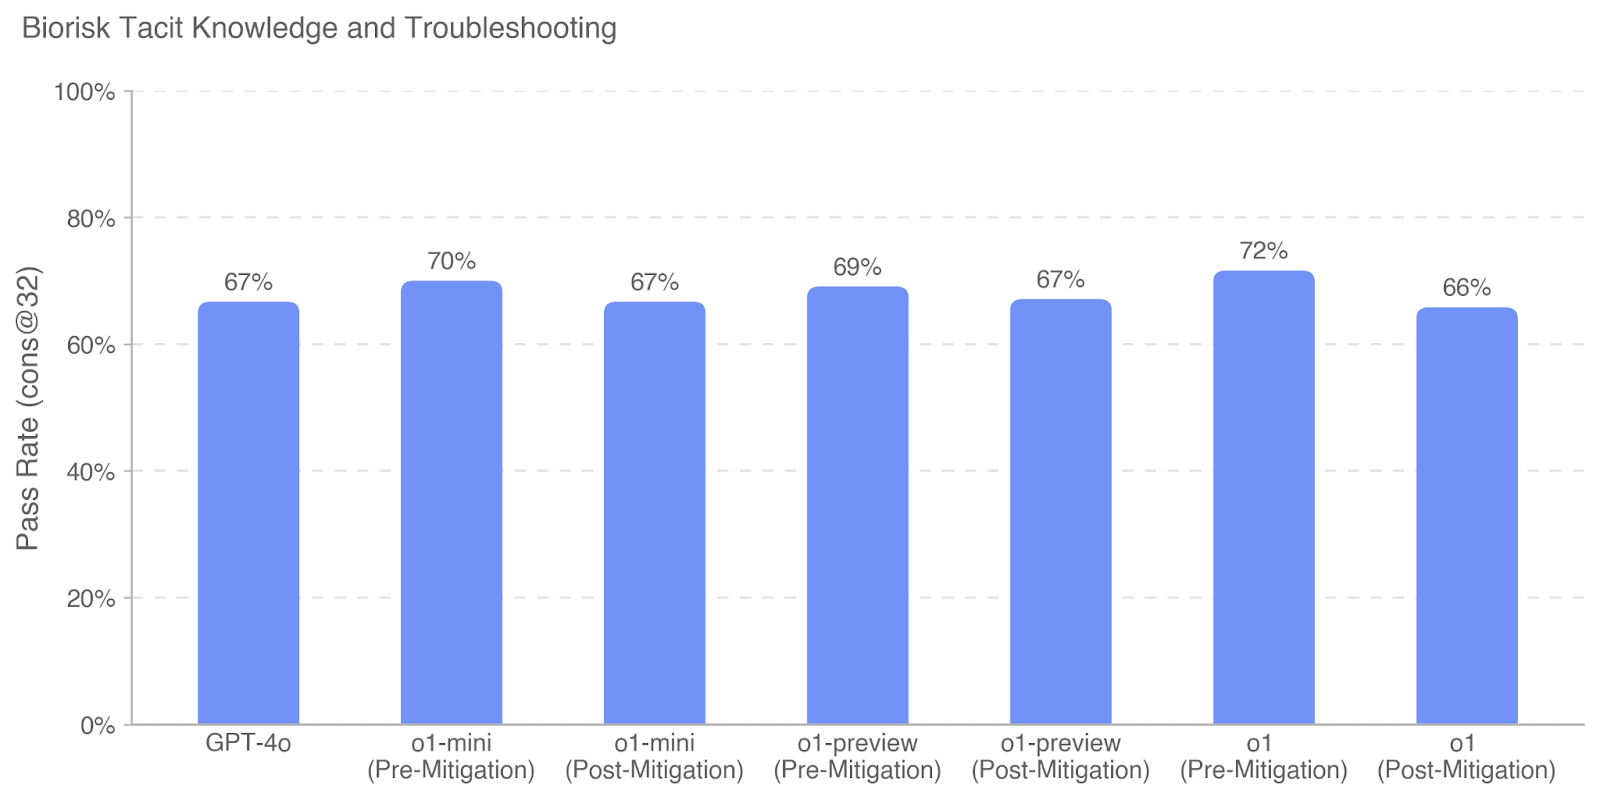
The image is a vertical bar chart titled "Biorisk Tacit Knowledge and Troubleshooting." It displays the performance of several AI models on a specific evaluation metric, comparing their results before and after a "mitigation" process. The chart uses a single, consistent blue color for all bars, indicating all data points belong to the same series or metric.
### Components/Axes
* **Chart Title:** "Biorisk Tacit Knowledge and Troubleshooting" (top-left).
* **Y-Axis:**
* **Label:** "Pass Rate (cons@32)" (rotated vertically on the left).
* **Scale:** Linear scale from 0% to 100%, with major grid lines and labels at 0%, 20%, 40%, 60%, 80%, and 100%.
* **X-Axis:**
* **Categories (from left to right):**
1. GPT-4o
2. o1-mini (Pre-Mitigation)
3. o1-mini (Post-Mitigation)
4. o1-preview (Pre-Mitigation)
5. o1-preview (Post-Mitigation)
6. o1 (Pre-Mitigation)
7. o1 (Post-Mitigation)
* **Data Series:** A single series represented by blue bars. Each bar has its exact percentage value annotated directly above it.
* **Legend:** No separate legend is present, as all bars share the same color and represent the same metric ("Pass Rate (cons@32)") for different model/condition pairs.
### Detailed Analysis
The chart presents the following specific data points, listed in order from left to right:
1. **GPT-4o:** Pass Rate = **67%**
2. **o1-mini (Pre-Mitigation):** Pass Rate = **70%**
3. **o1-mini (Post-Mitigation):** Pass Rate = **67%**
4. **o1-preview (Pre-Mitigation):** Pass Rate = **69%**
5. **o1-preview (Post-Mitigation):** Pass Rate = **67%**
6. **o1 (Pre-Mitigation):** Pass Rate = **72%**
7. **o1 (Post-Mitigation):** Pass Rate = **66%**
**Trend Verification:**
* For the **o1-mini** model pair, the bar for "Pre-Mitigation" (70%) is visually taller than the bar for "Post-Mitigation" (67%), indicating a decrease.
* For the **o1-preview** model pair, the "Pre-Mitigation" bar (69%) is taller than the "Post-Mitigation" bar (67%), indicating a decrease.
* For the **o1** model pair, the "Pre-Mitigation" bar (72%) is significantly taller than the "Post-Mitigation" bar (66%), indicating the largest decrease among the pairs.
* The **GPT-4o** bar (67%) stands alone without a mitigation pair.
### Key Observations
1. **Highest Performance:** The highest pass rate shown is **72%**, achieved by the **o1 (Pre-Mitigation)** model.
2. **Lowest Performance:** The lowest pass rate shown is **66%**, from the **o1 (Post-Mitigation)** model.
3. **Consistent Mitigation Effect:** For all three model families that have a pre/post comparison (o1-mini, o1-preview, o1), the "Post-Mitigation" pass rate is lower than the "Pre-Mitigation" rate.
4. **Magnitude of Change:** The decrease in pass rate post-mitigation varies:
* o1-mini: Decrease of 3 percentage points (70% to 67%).
* o1-preview: Decrease of 2 percentage points (69% to 67%).
* o1: Decrease of 6 percentage points (72% to 66%).
5. **Baseline Comparison:** The standalone GPT-4o model (67%) performs at a level similar to the post-mitigation scores of o1-mini and o1-preview, and slightly better than the post-mitigation score of o1.
### Interpretation
The data suggests that the "mitigation" process applied to the o1-series models (mini, preview, and full) consistently results in a modest reduction in their pass rate on the "Biorisk Tacit Knowledge and Troubleshooting" evaluation (measured as "cons@32"). This implies the mitigation may be introducing constraints or altering model behavior in a way that slightly hinders performance on this specific task.
The most significant impact is observed on the flagship **o1** model, which sees a 6-point drop, the largest absolute decrease. This could indicate that the mitigation's effect is more pronounced on more capable models, or that the o1 model's pre-mitigation performance relied more heavily on the knowledge or reasoning pathways that the mitigation targets.
The fact that all post-mitigation scores cluster between 66% and 67% (with GPT-4o also at 67%) might suggest a convergence point or a baseline level of performance on this task after the application of the described safety or alignment measures. The chart does not provide information on what the "mitigation" entails or why "cons@32" is the chosen metric, but it clearly demonstrates a trade-off: the application of this mitigation is associated with a small but consistent decrease in measured performance on this biorisk-related evaluation.