## Bar Chart: Biorisk Tacit Knowledge and Troubleshooting
### Overview
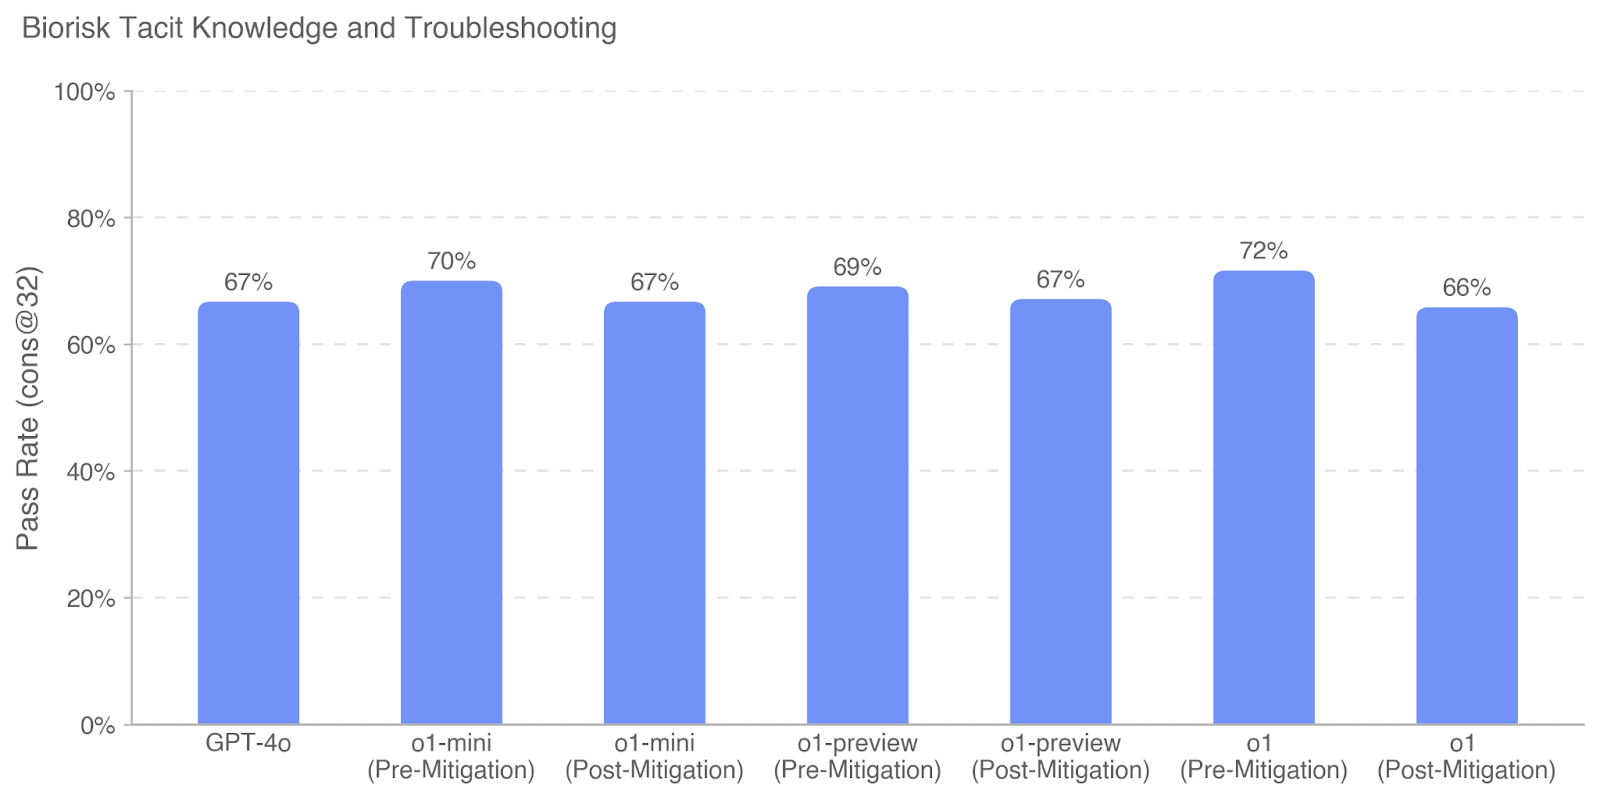
The chart visualizes pass rates (cons@32) for different AI models and their mitigation states. It compares performance across six categories: GPT-4o, o1-mini (Pre-Mitigation), o1-mini (Post-Mitigation), o1-preview (Pre-Mitigation), o1-preview (Post-Mitigation), o1 (Pre-Mitigation), and o1 (Post-Mitigation). All bars are blue, with no explicit legend present.
### Components/Axes
- **X-Axis**: Categories of AI models and mitigation states (e.g., "GPT-4o," "o1-mini (Pre-Mitigation)"). Labels are centered below the bars.
- **Y-Axis**: "Pass Rate (cons@32)" with percentage values from 0% to 100%, marked in 20% increments.
- **Bars**: All bars are blue, with no legend to distinguish categories. Heights correspond to pass rates.
### Detailed Analysis
- **GPT-4o**: 67% pass rate.
- **o1-mini (Pre-Mitigation)**: 70% pass rate.
- **o1-mini (Post-Mitigation)**: 67% pass rate.
- **o1-preview (Pre-Mitigation)**: 69% pass rate.
- **o1-preview (Post-Mitigation)**: 67% pass rate.
- **o1 (Pre-Mitigation)**: 72% pass rate (highest).
- **o1 (Post-Mitigation)**: 66% pass rate (lowest).
### Key Observations
1. **Highest Performance**: o1 (Pre-Mitigation) achieves the highest pass rate at 72%.
2. **Lowest Performance**: o1 (Post-Mitigation) drops to 66%, the lowest among all categories.
3. **Consistency**: Most models (GPT-4o, o1-mini, o1-preview) show minimal variation between pre- and post-mitigation states (67–69%).
4. **Outlier**: o1 (Pre-Mitigation) stands out with a 72% pass rate, significantly higher than others.
### Interpretation
The data suggests that **pre-mitigation models generally perform better** than their post-mitigation counterparts. The o1 model exhibits the largest drop (72% → 66%) post-mitigation, indicating mitigation may reduce its effectiveness. Other models show smaller changes (e.g., o1-mini: 70% → 67%), suggesting mitigation impacts vary by model. The consistency of GPT-4o and o1-preview across states implies mitigation has limited effect on their performance. This could reflect differences in how mitigation strategies are applied or their inherent robustness to such changes.