## Line Chart: Time vs. Number of Chunks/Latents
### Overview
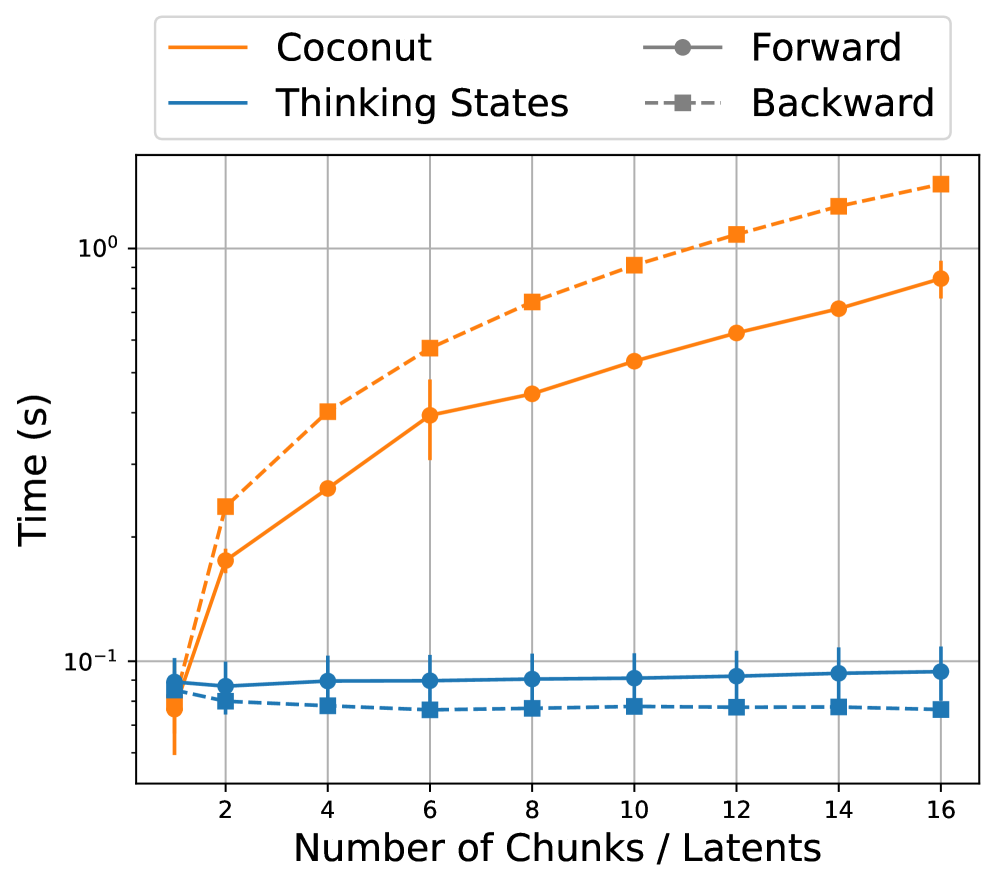
The image is a line chart comparing the time (in seconds) taken by four different processes ("Coconut", "Thinking States", "Forward", and "Backward") as the number of chunks/latents increases from 1 to 16. The y-axis (Time) is on a logarithmic scale.
### Components/Axes
* **X-axis:** "Number of Chunks / Latents" with tick marks at 2, 4, 6, 8, 10, 12, 14, and 16.
* **Y-axis:** "Time (s)" with a logarithmic scale. Tick marks are at 10^-1 (0.1) and 10^0 (1).
* **Legend (Top-Left):**
* Coconut (Solid Orange Line)
* Thinking States (Solid Blue Line)
* Forward (Solid Gray Line)
* Backward (Dashed Gray Line with Square Markers)
* Grid lines are present.
### Detailed Analysis
* **Coconut (Solid Orange Line):** The time increases as the number of chunks/latents increases.
* At 1 chunk/latent, the time is approximately 0.08s +/- 0.02s.
* At 4 chunks/latents, the time is approximately 0.20s +/- 0.02s.
* At 8 chunks/latents, the time is approximately 0.40s +/- 0.02s.
* At 16 chunks/latents, the time is approximately 0.80s +/- 0.02s.
* **Thinking States (Solid Blue Line):** The time remains relatively constant as the number of chunks/latents increases.
* The time is approximately 0.08s +/- 0.01s across all values of chunks/latents.
* **Forward (Solid Gray Line):** The time remains relatively constant as the number of chunks/latents increases.
* The time is approximately 0.09s +/- 0.01s across all values of chunks/latents.
* **Backward (Dashed Gray Line with Square Markers):** The time remains relatively constant as the number of chunks/latents increases.
* At 1 chunk/latent, the time is approximately 0.09s +/- 0.01s.
* At 4 chunks/latents, the time is approximately 0.07s +/- 0.01s.
* At 8 chunks/latents, the time is approximately 0.07s +/- 0.01s.
* At 16 chunks/latents, the time is approximately 0.07s +/- 0.01s.
* **Coconut (Dashed Orange Line with Square Markers):** The time increases as the number of chunks/latents increases.
* At 1 chunk/latent, the time is approximately 0.08s +/- 0.02s.
* At 4 chunks/latents, the time is approximately 0.30s +/- 0.02s.
* At 8 chunks/latents, the time is approximately 0.70s +/- 0.02s.
* At 16 chunks/latents, the time is approximately 1.50s +/- 0.02s.
### Key Observations
* The "Coconut" process (solid orange line) exhibits a significant increase in time as the number of chunks/latents increases, while the dashed orange line increases even more.
* The "Thinking States", "Forward", and "Backward" processes maintain a relatively constant time regardless of the number of chunks/latents.
* The y-axis is logarithmic, so the linear-appearing increase in "Coconut" actually represents exponential growth.
### Interpretation
The chart suggests that the "Coconut" process is significantly more sensitive to the number of chunks/latents compared to the other three processes. The "Thinking States", "Forward", and "Backward" processes appear to be largely unaffected by the number of chunks/latents, at least within the range tested (1 to 16). The logarithmic scale highlights the exponential nature of the time increase for the "Coconut" process, indicating a potential bottleneck or scalability issue.