# Technical Document Analysis of Chart
## Chart Overview
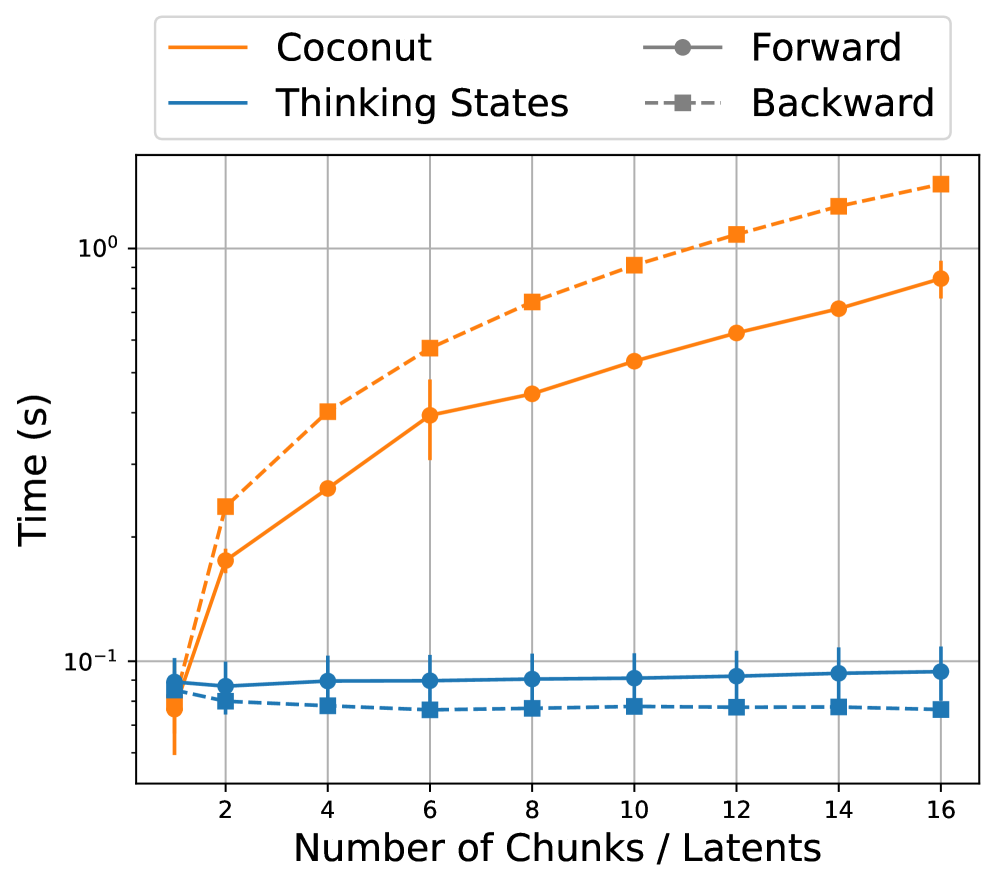
The image is a **line chart** comparing the performance of two algorithms ("Coconut" and "Thinking States") across varying numbers of "Chunks / Latents." The y-axis represents **Time (s)** on a **logarithmic scale**, while the x-axis represents the **Number of Chunks / Latents** (ranging from 2 to 16). The chart includes error bars for data points and distinguishes between "Forward" and "Backward" passes using line styles.
---
### Key Components
1. **Legend**
- **Location**: Top-right corner.
- **Labels**:
- **Orange**: Coconut (solid line for Forward, dashed line for Backward).
- **Blue**: Thinking States (solid line for Forward, dashed line for Backward).
2. **Axes**
- **X-axis**:
- Title: "Number of Chunks / Latents"
- Values: 2, 4, 6, 8, 10, 12, 14, 16 (even increments).
- **Y-axis**:
- Title: "Time (s)"
- Scale: Logarithmic (10⁻¹ to 10⁰).
- Markers: 10⁻¹, 10⁰.
3. **Data Series**
- **Coconut (Orange)**:
- **Forward** (solid line): Time increases with more chunks/latents.
- **Backward** (dashed line): Time increases similarly but starts higher than Forward.
- **Thinking States (Blue)**:
- **Forward** (solid line): Time remains nearly constant (~0.08s) across all chunks/latents.
- **Backward** (dashed line): Time remains nearly constant (~0.06s) across all chunks/latents.
4. **Error Bars**
- Present for all data points, indicating variability in measurements.
---
### Trends and Observations
1. **Coconut Algorithm**
- **Forward Pass**:
- Time increases logarithmically with more chunks/latents.
- Example: At 2 chunks, ~0.05s; at 16 chunks, ~0.9s.
- **Backward Pass**:
- Time increases similarly to Forward but starts higher (e.g., ~0.1s at 2 chunks vs. ~0.05s for Forward).
2. **Thinking States Algorithm**
- **Forward/Backward Passes**:
- Time remains nearly constant (~0.08s for Forward, ~0.06s for Backward) regardless of chunks/latents.
3. **Error Bars**
- Coconut shows larger variability (longer error bars) compared to Thinking States.
---
### Spatial Grounding and Accuracy Checks
- **Legend Colors**:
- Orange matches Coconut (solid/Dashed).
- Blue matches Thinking States (solid/Dashed).
- **Data Point Alignment**:
- Coconut Forward (solid orange) aligns with increasing trend.
- Thinking States Forward (solid blue) aligns with flat trend.
---
### Missing Elements
- **Data Table**: Not explicitly provided; data is represented visually via plotted points and error bars.
- **Footer/Additional Text**: None present.
---
### Final Notes
The chart emphasizes that **Coconut** exhibits scalability with increasing chunks/latents, while **Thinking States** maintains consistent performance. Error bars suggest higher variability in Coconut's measurements.