## Bar Chart: Code Number Increase with Groups
### Overview
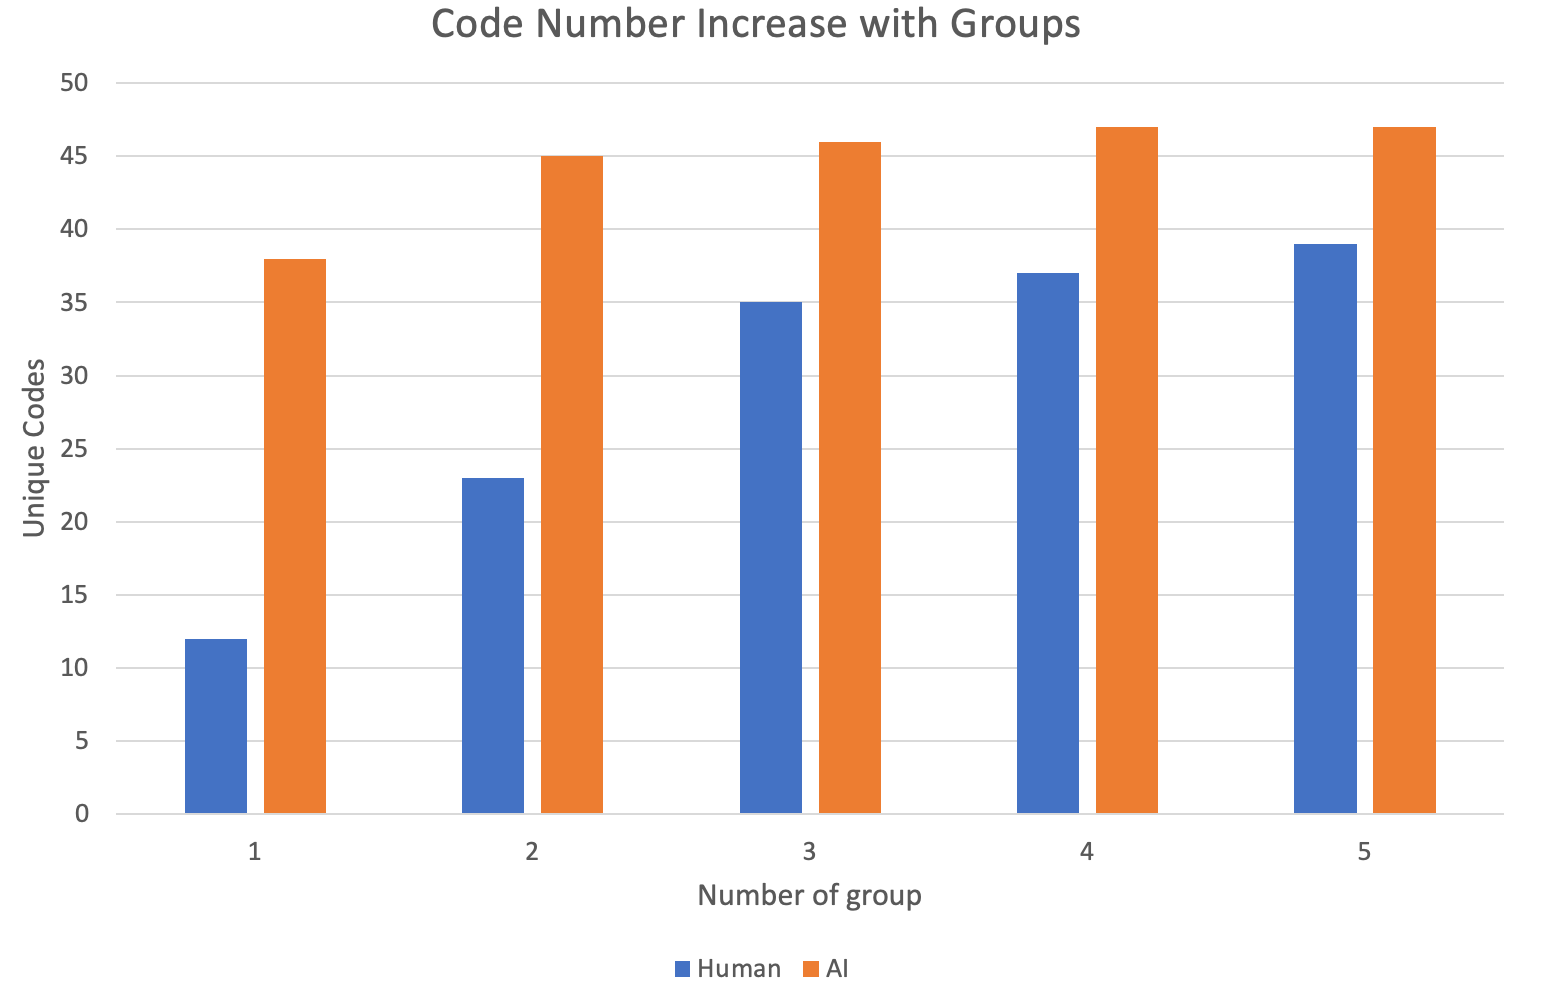
The image is a bar chart comparing the number of unique codes generated by humans and AI across different group sizes (1 to 5). The y-axis represents the number of unique codes, ranging from 0 to 50. The x-axis represents the number of groups, ranging from 1 to 5. Each group size has two bars, one representing human-generated codes (blue) and the other representing AI-generated codes (orange).
### Components/Axes
* **Title:** Code Number Increase with Groups
* **X-axis Title:** Number of group
* **X-axis Markers:** 1, 2, 3, 4, 5
* **Y-axis Title:** Unique Codes
* **Y-axis Markers:** 0, 5, 10, 15, 20, 25, 30, 35, 40, 45, 50
* **Legend:** Located at the bottom of the chart.
* Blue: Human
* Orange: AI
### Detailed Analysis
Here's a breakdown of the data for each group size:
* **Group 1:**
* Human (Blue): Approximately 12 unique codes.
* AI (Orange): Approximately 38 unique codes.
* **Group 2:**
* Human (Blue): Approximately 23 unique codes.
* AI (Orange): Approximately 45 unique codes.
* **Group 3:**
* Human (Blue): Approximately 35 unique codes.
* AI (Orange): Approximately 46 unique codes.
* **Group 4:**
* Human (Blue): Approximately 37 unique codes.
* AI (Orange): Approximately 47 unique codes.
* **Group 5:**
* Human (Blue): Approximately 39 unique codes.
* AI (Orange): Approximately 47 unique codes.
### Key Observations
* AI consistently generates more unique codes than humans across all group sizes.
* The number of unique codes generated by humans increases with the group size.
* The number of unique codes generated by AI is relatively stable across group sizes, with a slight increase from group 1 to group 2, then plateauing.
### Interpretation
The data suggests that AI is more efficient at generating unique codes compared to humans, regardless of the group size. The increasing trend in human-generated codes indicates that humans may benefit from larger group sizes, potentially due to increased collaboration or idea sharing. The relatively stable number of AI-generated codes suggests that AI's performance is less dependent on group size. The AI generated codes are consistently higher than the human generated codes, suggesting that AI may be better at exploring the code space.