## Bar Chart: Code Number Increase with Groups
### Overview
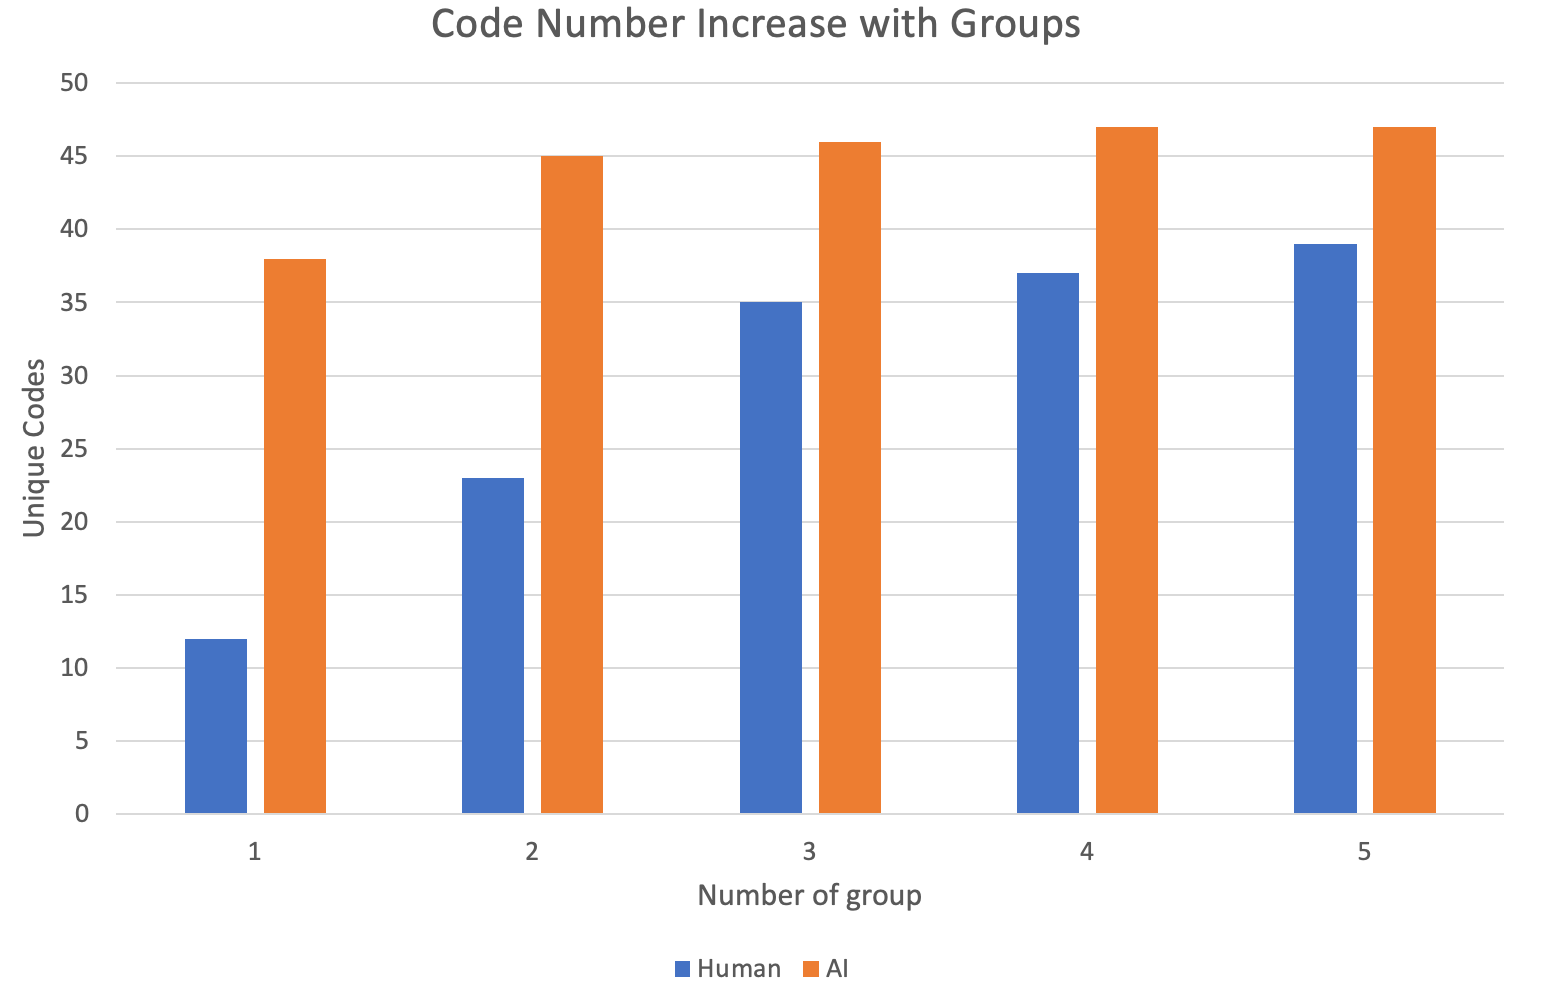
This image is a bar chart that displays the number of unique codes generated by "Human" and "AI" across five different "Number of group" categories. The chart visually compares the performance of Human and AI in generating unique codes as the group number increases.
### Components/Axes
* **Title:** "Code Number Increase with Groups"
* **Y-axis Title:** "Unique Codes"
* **Y-axis Scale:** Ranges from 0 to 50, with major tick marks at intervals of 5 (0, 5, 10, 15, 20, 25, 30, 35, 40, 45, 50).
* **X-axis Title:** "Number of group"
* **X-axis Categories:** Labeled 1, 2, 3, 4, and 5.
* **Legend:** Located at the bottom center of the chart.
* **Blue Square:** Represents "Human".
* **Orange Square:** Represents "AI".
### Detailed Analysis
The chart presents paired bars for each group number, with blue bars representing "Human" and orange bars representing "AI".
* **Group 1:**
* Human (Blue bar): Approximately 12 unique codes.
* AI (Orange bar): Approximately 38 unique codes.
* **Group 2:**
* Human (Blue bar): Approximately 23 unique codes.
* AI (Orange bar): Approximately 45 unique codes.
* **Group 3:**
* Human (Blue bar): Approximately 35 unique codes.
* AI (Orange bar): Approximately 46 unique codes.
* **Group 4:**
* Human (Blue bar): Approximately 37 unique codes.
* AI (Orange bar): Approximately 47 unique codes.
* **Group 5:**
* Human (Blue bar): Approximately 39 unique codes.
* AI (Orange bar): Approximately 47 unique codes.
**Trend Verification:**
* **Human (Blue bars):** The number of unique codes generated by humans shows a generally upward trend from Group 1 to Group 5. The increase is most significant between Group 1 and Group 3, with smaller increases thereafter.
* **AI (Orange bars):** The number of unique codes generated by AI also shows an upward trend from Group 1 to Group 4. The number of unique codes generated by AI appears to plateau or increase very slightly between Group 3, Group 4, and Group 5.
### Key Observations
* **AI consistently outperforms Human:** In all five groups, AI generates a significantly higher number of unique codes compared to humans.
* **Growth Rate:** While both Human and AI show an increase in unique codes with larger group numbers, the AI's performance starts at a much higher baseline and its growth rate appears to slow down or plateau at higher group numbers, whereas the human's growth rate is more consistent, albeit from a lower starting point.
* **Largest Gap:** The largest absolute difference in unique codes between AI and Human occurs in Group 1 (approximately 26 codes).
* **Smallest Gap:** The smallest absolute difference in unique codes between AI and Human occurs in Group 3 (approximately 11 codes) and Group 5 (approximately 8 codes).
### Interpretation
This bar chart demonstrates a clear advantage of AI over humans in generating unique codes, particularly at the initial stages (Group 1). The data suggests that AI is more efficient or capable of producing a wider variety of codes from the outset.
The trend of increasing unique codes with larger group numbers for both Human and AI indicates that the complexity or scope of the task (represented by "Number of group") positively influences the diversity of generated codes. However, the plateauing of AI's performance at higher group numbers, while humans continue to show some increase, might suggest that AI reaches a saturation point or its current algorithm is optimized for a certain level of complexity. Conversely, humans might have a more adaptable or exploratory approach that allows for continued generation of novel codes even at higher group numbers, though at a much lower overall volume.
The data could imply that for tasks requiring a high volume of diverse codes, AI is superior. However, if the goal is to explore a broader range of possibilities or if the task complexity continues to increase significantly, human performance might become relatively more competitive in terms of incremental improvement, even if the absolute numbers remain lower. Further investigation could explore the nature of these "codes" and the specific task being performed to understand the underlying reasons for these performance differences.