\n
## Bar Chart: Code Number Increase with Groups
### Overview
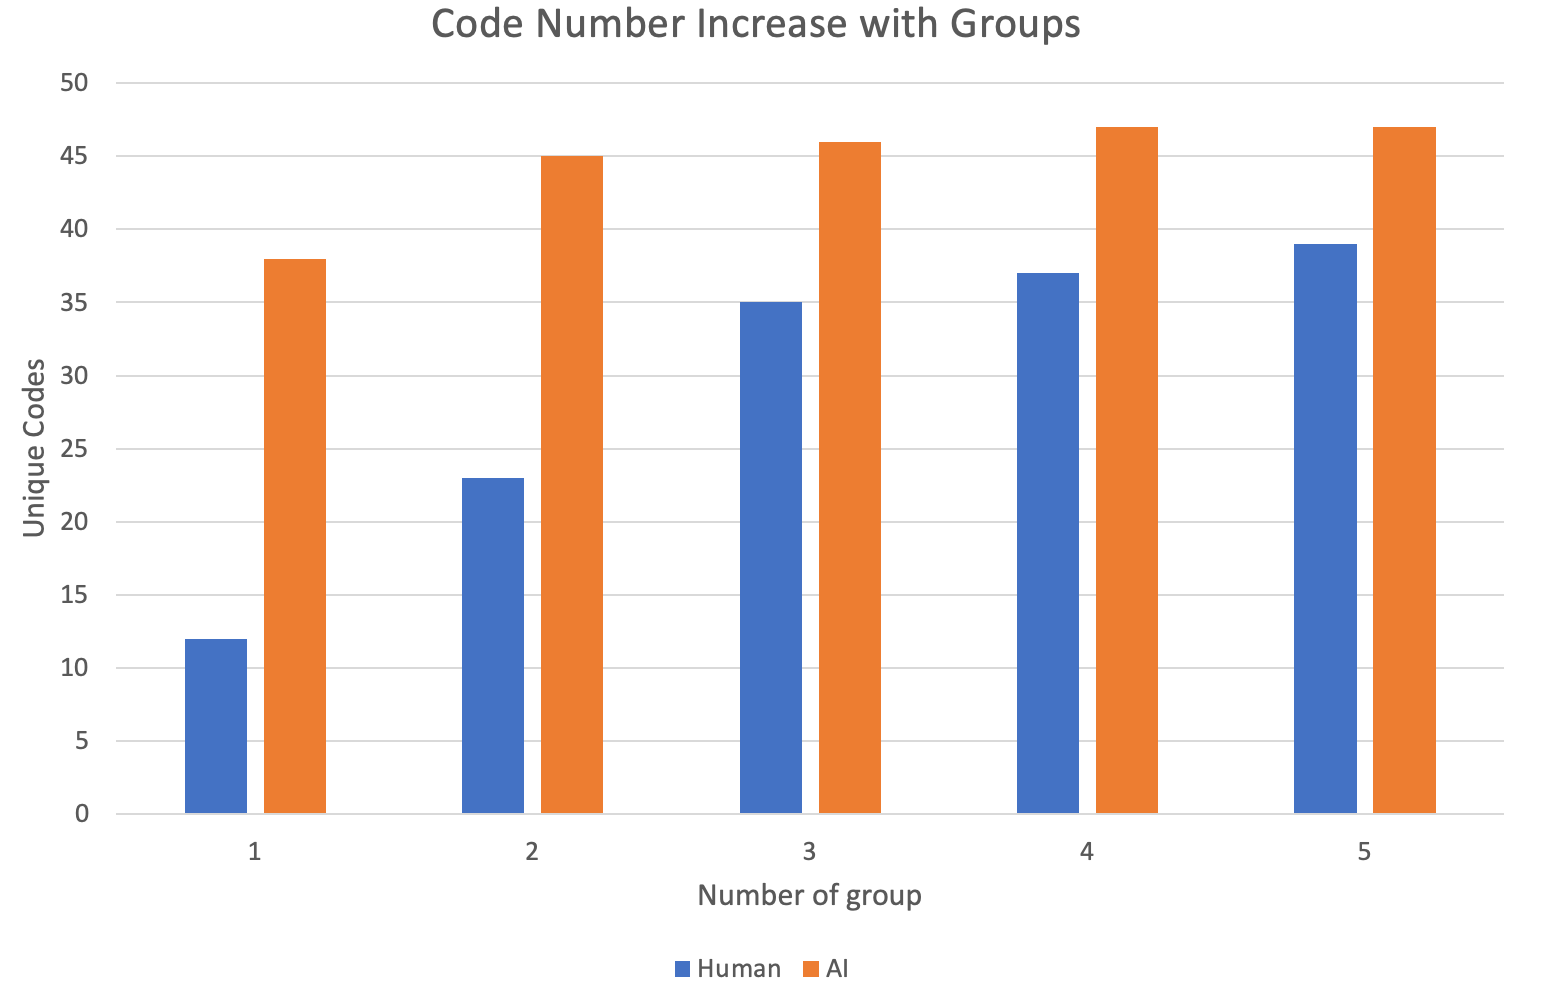
This is a bar chart illustrating the increase in the number of unique codes generated by humans and an AI across five different groups. The x-axis represents the group number (1 to 5), and the y-axis represents the number of unique codes. Two data series are presented: one for "Human" generated codes (blue bars) and one for "AI" generated codes (orange bars).
### Components/Axes
* **Title:** "Code Number Increase with Groups" (positioned at the top-center)
* **X-axis Label:** "Number of group" (positioned at the bottom-center)
* **X-axis Markers:** 1, 2, 3, 4, 5 (equally spaced along the x-axis)
* **Y-axis Label:** "Unique Codes" (positioned on the left-center)
* **Y-axis Scale:** 0 to 50, with increments of 5.
* **Legend:** Located at the bottom-center.
* **Human:** Represented by a blue bar.
* **AI:** Represented by an orange bar.
### Detailed Analysis
The chart consists of ten bars, five for each data series (Human and AI).
**Human (Blue Bars):**
* **Group 1:** Approximately 11 unique codes.
* **Group 2:** Approximately 24 unique codes. The bar rises significantly.
* **Group 3:** Approximately 34 unique codes. Continues to rise.
* **Group 4:** Approximately 36 unique codes. A slight increase.
* **Group 5:** Approximately 38 unique codes. A small increase.
**AI (Orange Bars):**
* **Group 1:** Approximately 37 unique codes.
* **Group 2:** Approximately 46 unique codes. The bar rises significantly.
* **Group 3:** Approximately 46 unique codes. Remains constant.
* **Group 4:** Approximately 46 unique codes. Remains constant.
* **Group 5:** Approximately 48 unique codes. A small increase.
The AI consistently generates a higher number of unique codes than humans across all groups. Both series show an increasing trend in unique codes as the group number increases, but the rate of increase slows down for both series in the later groups.
### Key Observations
* The AI consistently outperforms humans in generating unique codes.
* Both humans and the AI show an initial rapid increase in unique codes from Group 1 to Group 2, followed by a slower, more gradual increase in subsequent groups.
* The AI's code generation plateaus between Groups 2 and 4, remaining at approximately 46 unique codes.
* The difference in unique codes between humans and the AI is most pronounced in Group 1, and narrows as the group number increases.
### Interpretation
The data suggests that the AI is more effective at generating unique codes than humans, particularly in the initial groups. The initial rapid increase in code generation for both humans and the AI could be due to the introduction of new concepts or challenges in each group. The plateau in the AI's code generation from Groups 2 to 4 might indicate that the AI has reached a limit in its ability to generate novel codes within the given constraints, or that the task has become saturated. The continued, albeit slower, increase in code generation for both humans and the AI in the later groups suggests that they are still able to adapt and generate new codes, but at a diminishing rate. This could be due to the increasing difficulty of the task or the exhaustion of available coding possibilities. The chart demonstrates a clear difference in performance between human and AI code generation, with the AI consistently producing a higher number of unique codes.