## Horizontal Bar Chart: Median Score by Metric
### Overview
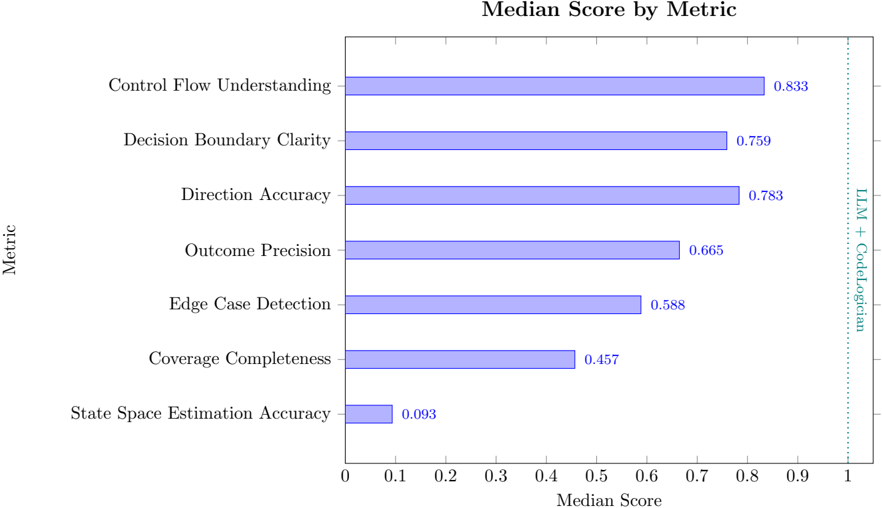
The image is a horizontal bar chart displaying the median scores for different metrics. The metrics are listed on the vertical axis, and the median scores are represented by the length of the horizontal bars. A vertical dotted line indicates the performance of "LLM + CodeLogician".
### Components/Axes
* **Title:** Median Score by Metric
* **Vertical Axis (Metric):**
* Control Flow Understanding
* Decision Boundary Clarity
* Direction Accuracy
* Outcome Precision
* Edge Case Detection
* Coverage Completeness
* State Space Estimation Accuracy
* **Horizontal Axis (Median Score):**
* Scale: 0 to 1
* Increments: 0.1
* **Vertical Dotted Line:** Labeled "LLM + CodeLogician" at x = 1
### Detailed Analysis
The chart presents median scores for seven different metrics. Each metric has a corresponding horizontal bar, with the length of the bar indicating the median score. The scores are as follows:
* **Control Flow Understanding:** 0.833
* **Decision Boundary Clarity:** 0.759
* **Direction Accuracy:** 0.783
* **Outcome Precision:** 0.665
* **Edge Case Detection:** 0.588
* **Coverage Completeness:** 0.457
* **State Space Estimation Accuracy:** 0.093
The "LLM + CodeLogician" performance is marked by a vertical dotted line at a median score of 1.
### Key Observations
* "Control Flow Understanding" has the highest median score (0.833).
* "State Space Estimation Accuracy" has the lowest median score (0.093).
* The scores vary significantly across the different metrics.
* All metrics score below the "LLM + CodeLogician" benchmark of 1.
### Interpretation
The chart provides a comparative analysis of the median scores for different metrics. The data suggests that "Control Flow Understanding" is the strongest area, while "State Space Estimation Accuracy" is the weakest. The vertical line representing "LLM + CodeLogician" serves as a benchmark, indicating the target performance level. The fact that all metrics score below this benchmark suggests areas for improvement. The large variance in scores across metrics indicates that performance is not uniform across all areas.