## Horizontal Bar Chart: Median Score by Metric
### Overview
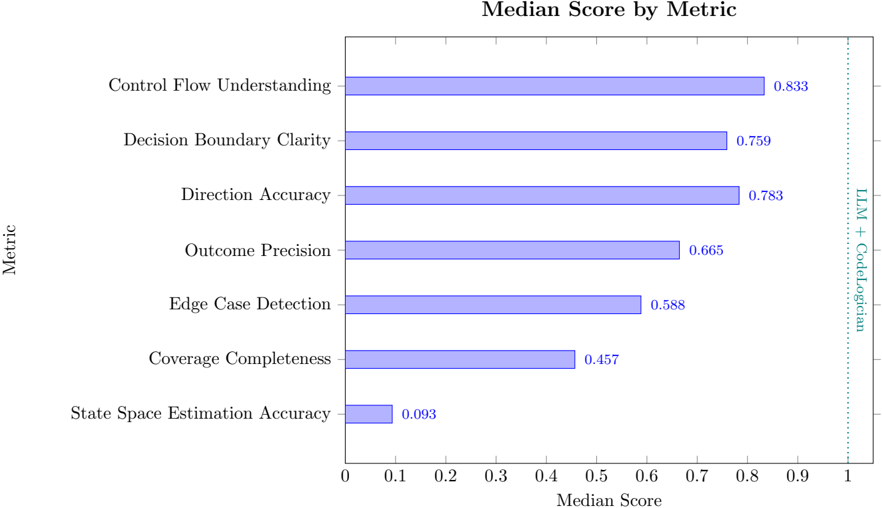
The image displays a horizontal bar chart titled "Median Score by Metric." It presents median performance scores for seven distinct metrics, presumably evaluating a system or model identified as "LLM + CodeLogician." The chart uses a single color (light purple) for all bars, with numerical values annotated at the end of each bar.
### Components/Axes
* **Chart Title:** "Median Score by Metric" (Top Center).
* **Y-Axis (Vertical):** Labeled "Metric." It lists seven categorical metrics from top to bottom.
* **X-Axis (Horizontal):** Labeled "Median Score." It has a linear scale ranging from 0 to 1, with major tick marks at every 0.1 interval (0, 0.1, 0.2, ..., 1).
* **Data Series:** A single series represented by horizontal bars. The bars are filled with a light purple color (approximately #9999ff).
* **Data Labels:** Each bar has its exact median score value displayed to its right, in the same light purple color.
* **Subtitle/Annotation:** Vertically oriented text on the far right side of the chart reads "LLM + CodeLogician," indicating the subject of the evaluation.
### Detailed Analysis
The chart lists the metrics in descending order of their median score. The specific values are:
1. **Control Flow Understanding:** Score = 0.833. This is the highest-scoring metric.
2. **Decision Boundary Clarity:** Score = 0.759.
3. **Direction Accuracy:** Score = 0.783. *(Note: This score is higher than the metric listed above it, indicating the metrics are not perfectly sorted by value.)*
4. **Outcome Precision:** Score = 0.665.
5. **Edge Case Detection:** Score = 0.588.
6. **Coverage Completeness:** Score = 0.457.
7. **State Space Estimation Accuracy:** Score = 0.093. This is the lowest-scoring metric by a significant margin.
**Trend Verification:** The visual trend shows a general decline in bar length from top to bottom, with the exception of "Direction Accuracy" (0.783) being longer than "Decision Boundary Clarity" (0.759). The final bar for "State Space Estimation Accuracy" is dramatically shorter than all others.
### Key Observations
* **Performance Spread:** There is a wide performance gap (0.740 points) between the highest-scoring metric (Control Flow Understanding: 0.833) and the lowest (State Space Estimation Accuracy: 0.093).
* **Clustering:** The top four metrics all score above 0.65, suggesting relative strength in areas related to understanding logic, boundaries, direction, and outcomes.
* **Significant Outlier:** "State Space Estimation Accuracy" is a severe outlier, performing drastically worse than all other metrics. Its score is less than one-fifth of the next lowest metric.
* **Ordering Anomaly:** The metrics are not listed in strict descending order of score, as "Direction Accuracy" (0.783) is placed below "Decision Boundary Clarity" (0.759).
### Interpretation
This chart provides a performance profile for the "LLM + CodeLogician" system across seven technical evaluation dimensions. The data suggests the system is relatively proficient at understanding program logic and structure (Control Flow, Decision Boundaries, Direction) and achieving precise outcomes. However, it shows moderate capability in detecting edge cases and ensuring complete coverage.
The most critical finding is the system's profound weakness in **State Space Estimation Accuracy**. This indicates a fundamental limitation in modeling or predicting the full range of possible states within the problem domain it is addressing. This single, severe deficiency could be a major bottleneck for reliability in complex, stateful applications, despite strengths in other areas. The chart effectively highlights that overall system evaluation cannot rely on a single aggregate score, as performance is highly metric-dependent.