## Bar Chart: Median Score by Metric
### Overview
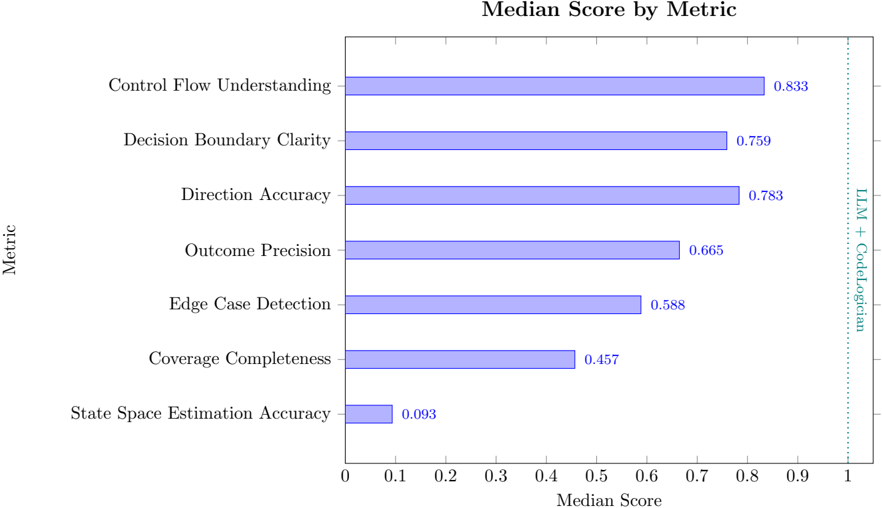
The chart displays median scores for seven technical metrics related to code understanding and analysis. A vertical dotted line at 0.9 (labeled "LLM + CodeLogician") serves as a reference benchmark. All bars are colored blue, with numerical values explicitly labeled at the end of each bar.
### Components/Axes
- **Y-Axis (Metric)**:
- Control Flow Understanding
- Decision Boundary Clarity
- Direction Accuracy
- Outcome Precision
- Edge Case Detection
- Coverage Completeness
- State Space Estimation Accuracy
- **X-Axis (Median Score)**:
- Scale from 0 to 1.0 in increments of 0.1
- Dotted reference line at 0.9 labeled "LLM + CodeLogician"
- **Legend**:
- Single entry: "LLM + CodeLogician" (blue dotted line)
### Detailed Analysis
1. **Control Flow Understanding**: 0.833 (highest score, closest to 0.9 benchmark)
2. **Decision Boundary Clarity**: 0.759
3. **Direction Accuracy**: 0.783
4. **Outcome Precision**: 0.665
5. **Edge Case Detection**: 0.588
6. **Coverage Completeness**: 0.457
7. **State Space Estimation Accuracy**: 0.093 (lowest score, farthest from benchmark)
### Key Observations
- **Top Performers**: Control Flow Understanding (0.833), Direction Accuracy (0.783), and Decision Boundary Clarity (0.759) cluster near the 0.9 benchmark.
- **Mid-Range Metrics**: Outcome Precision (0.665) and Edge Case Detection (0.588) show moderate performance.
- **Weakness**: State Space Estimation Accuracy (0.093) is an extreme outlier, performing 10x worse than the next lowest metric.
- **Benchmark Gap**: No metric reaches the 0.9 "LLM + CodeLogician" threshold, with the closest being 0.833 (Control Flow Understanding).
### Interpretation
The chart reveals a clear hierarchy of strengths and weaknesses in code analysis capabilities:
1. **Strengths**: Control Flow Understanding and Direction Accuracy demonstrate robust performance, suggesting effective handling of code structure and navigation.
2. **Critical Weakness**: State Space Estimation Accuracy (0.093) indicates a fundamental gap in modeling complex code state transitions, which could severely impact tasks requiring deep code comprehension.
3. **Benchmark Proximity**: While top metrics approach the 0.9 threshold, the gap suggests room for improvement in aligning with advanced code logician capabilities.
4. **Anomaly**: The extreme outlier (State Space Estimation) warrants investigation into whether this reflects data collection issues, metric design flaws, or inherent technical challenges.
This analysis highlights prioritization opportunities: addressing State Space Estimation Accuracy could yield disproportionate improvements in overall code analysis capabilities.