# Technical Document Extraction: Perplexity vs. Context Length Chart
## 1. Component Isolation
* **Header:** None.
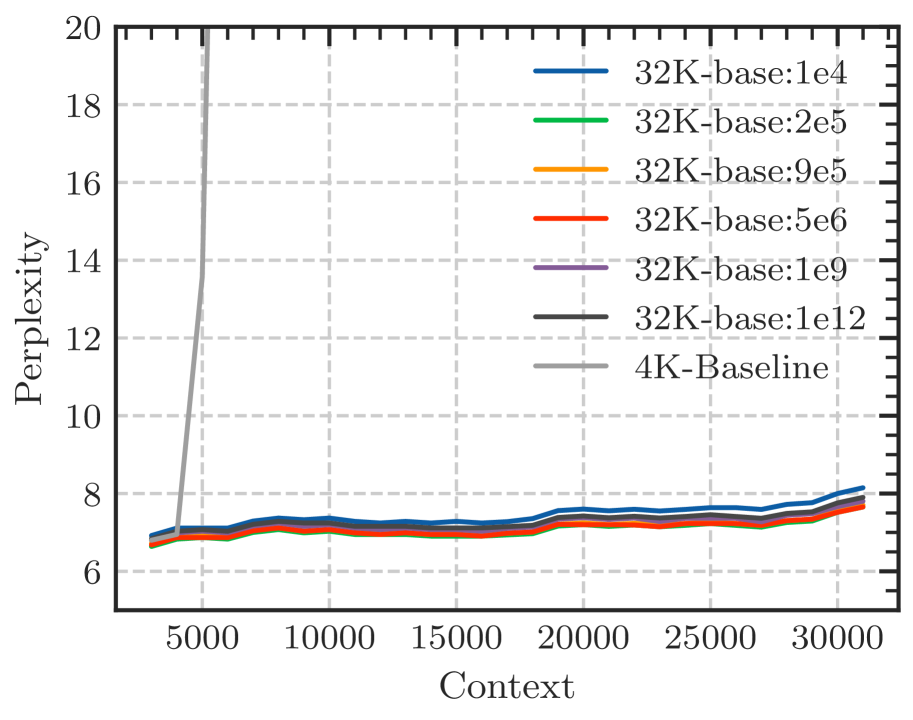
* **Main Chart Area:** A line graph plotting "Perplexity" (Y-axis) against "Context" (X-axis). It features a grid of dashed light-gray lines.
* **Legend:** Located in the upper-right quadrant of the chart area.
* **Axes:**
* **Y-axis (Vertical):** Labeled "Perplexity", ranging from 6 to 20 with major increments of 2.
* **X-axis (Horizontal):** Labeled "Context", ranging from approximately 4,000 to 32,000 with major labeled increments every 5,000 units (5000, 10000, 15000, 20000, 25000, 30000).
## 2. Legend Data Extraction
The legend is positioned at approximately `[x=0.75, y=0.25]` relative to the top-left corner of the image.
| Color | Label | Description |
| :--- | :--- | :--- |
| Blue | `32K-base:1e4` | 32K base model with 1e4 parameter/setting |
| Green | `32K-base:2e5` | 32K base model with 2e5 parameter/setting |
| Orange | `32K-base:9e5` | 32K base model with 9e5 parameter/setting |
| Red | `32K-base:5e6` | 32K base model with 5e6 parameter/setting |
| Purple | `32K-base:1e9` | 32K base model with 1e9 parameter/setting |
| Dark Gray | `32K-base:1e12` | 32K base model with 1e12 parameter/setting |
| Light Gray | `4K-Baseline` | Baseline model with 4K context limit |
## 3. Trend Verification and Data Analysis
### Series 1: 4K-Baseline (Light Gray)
* **Trend:** This line starts at a perplexity of ~7 at context 4,000. Immediately after the 4,000 mark, the line slopes sharply upward (vertically), exceeding the Y-axis limit of 20 before reaching context 6,000.
* **Significance:** Indicates total model failure/catastrophic perplexity increase once the context exceeds its trained limit of 4,000.
### Series 2-7: 32K-base variants (Multi-colored)
* **Trend:** All six "32K-base" lines follow a nearly identical, stable horizontal trajectory. They start between perplexity 6.5 and 7.0 at context 4,000 and remain below 8.5 even as context reaches 32,000. There is a very slight, gradual upward drift as context increases.
* **Relative Performance (Stacking Order):**
* **Highest Perplexity (Worst):** Blue (`32K-base:1e4`) consistently sits at the top of the cluster.
* **Lowest Perplexity (Best):** Red (`32K-base:5e6`) consistently sits at the bottom of the cluster.
* **Middle Cluster:** The Green, Orange, Purple, and Dark Gray lines are tightly interleaved between the Blue and Red lines, showing marginal differences in performance.
## 4. Key Data Points (Approximate)
| Context | 4K-Baseline (Perplexity) | 32K-base Cluster (Perplexity Range) |
| :--- | :--- | :--- |
| 4,000 | ~7.0 | 6.8 - 7.1 |
| 5,000 | ~14.0 (Rising sharply) | 6.9 - 7.2 |
| 10,000 | > 20 (Off-chart) | 7.0 - 7.4 |
| 20,000 | > 20 (Off-chart) | 7.2 - 7.6 |
| 30,000 | > 20 (Off-chart) | 7.5 - 8.0 |
| 32,000 | > 20 (Off-chart) | 7.8 - 8.2 |
## 5. Summary of Findings
The chart demonstrates the effectiveness of the "32K-base" model variants in maintaining low perplexity (high performance) across long context windows up to 32,000 tokens. In contrast, the "4K-Baseline" model experiences an immediate and extreme loss of performance as soon as the context window exceeds its 4,000-token design limit. Among the 32K variants, the `5e6` (Red) configuration appears to provide the most stable and lowest perplexity.