# Technical Document Extraction: Line Chart Analysis
## Chart Overview
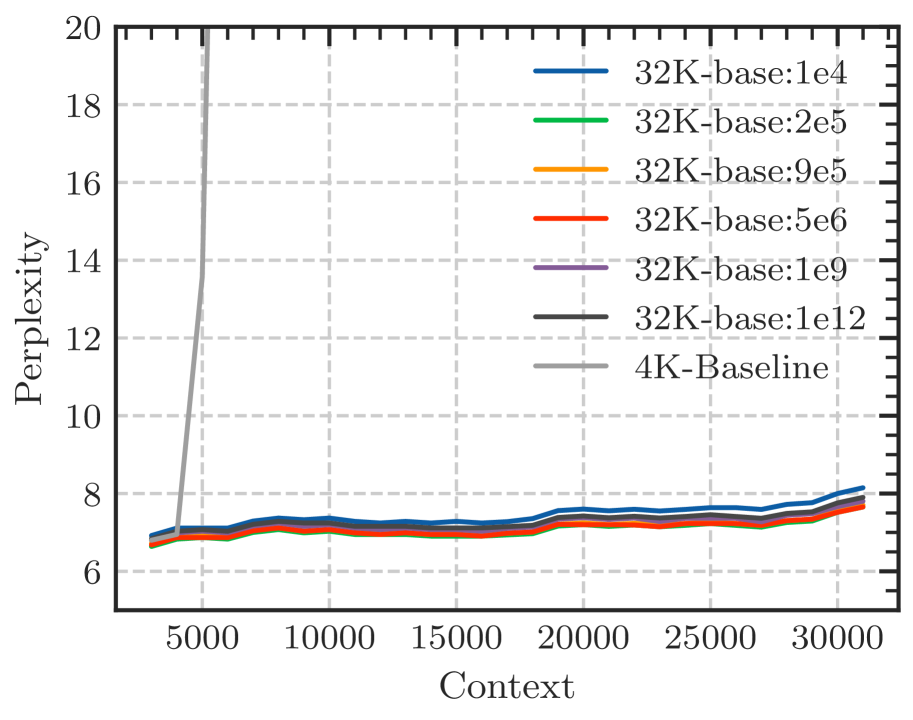
This image depicts a **line chart** comparing perplexity values across different model configurations. The chart includes six data series representing variations of a "32K-base" model with distinct base values, alongside a "4K-Baseline" reference line.
---
### **Axes and Labels**
- **X-Axis (Horizontal):**
- Label: `Context`
- Range: `5000` to `30000` (increments of `5000`).
- Tick marks: Dashed gray lines at each interval.
- **Y-Axis (Vertical):**
- Label: `Perplexity`
- Range: `6` to `20` (increments of `2`).
- Tick marks: Dashed gray lines at each interval.
---
### **Legend**
- **Position:** Right side of the chart, outside the plot area.
- **Entries (Color-Coded):**
1. **Blue:** `32K-base:1e4`
2. **Green:** `32K-base:2e5`
3. **Orange:** `32K-base:9e5`
4. **Red:** `32K-base:5e6`
5. **Purple:** `32K-base:1e9`
6. **Black:** `32K-base:1e12`
7. **Gray:** `4K-Baseline`
---
### **Data Series Analysis**
#### 1. **4K-Baseline (Gray Line)**
- **Trend:**
- Sharp vertical spike at `x=5000`, reaching `y=20`.
- Immediate drop to `y≈7` after `x=5000`.
- Remains relatively flat between `x=5000` and `x=30000`.
#### 2. **32K-Base Models**
All lines exhibit **low perplexity** (6–9) with minor fluctuations. Key observations:
- **Blue (`32K-base:1e4`):**
- Highest perplexity at `x=30000` (`y≈8.5`).
- Slight upward trend after `x=20000`.
- **Black (`32K-base:1e12`):**
- Second-highest perplexity (`y≈8.2`).
- Slightly smoother than the blue line.
- **Purple (`32K-base:1e9`):**
- Perplexity ≈ `8.0`.
- Minimal variation.
- **Red (`32K-base:5e6`):**
- Perplexity ≈ `7.8`.
- Slight dip near `x=25000`.
- **Orange (`32K-base:9e5`):**
- Perplexity ≈ `7.6`.
- Stable trend.
- **Green (`32K-base:2e5`):**
- Lowest perplexity (`y≈7.4`).
- Most stable line.
---
### **Key Trends**
1. **4K-Baseline** exhibits an anomalous spike at `x=5000`, suggesting a potential outlier or initialization effect.
2. **32K-Base Models** show inverse correlation between base value and perplexity:
- Higher base values (e.g., `1e12`) correlate with lower perplexity.
- Lower base values (e.g., `1e4`) correlate with higher perplexity.
3. All 32K-Base lines converge closely, indicating minimal divergence in performance across configurations.
---
### **Spatial Grounding**
- **Legend Placement:** Right-aligned, outside the plot boundary.
- **Line Colors:**
- Confirmed matches between legend labels and line colors (e.g., blue = `1e4`, green = `2e5`).
---
### **Conclusion**
The chart illustrates that increasing the `32K-base` value generally reduces perplexity, with the `4K-Baseline` serving as a reference for comparison. The `4K-Baseline`’s initial spike may indicate a distinct computational or architectural behavior at lower context sizes.