\n
## Line Chart: MSE vs. Pilot Size for Different Algorithms
### Overview
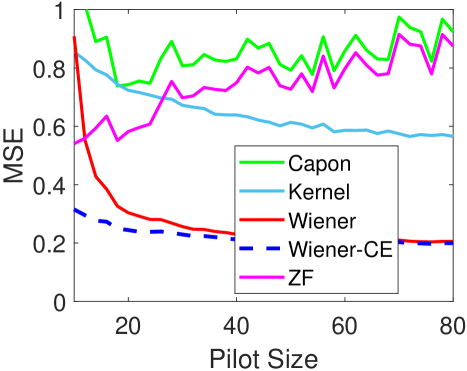
This image presents a line chart comparing the Mean Squared Error (MSE) performance of five different algorithms (Capon, Kernel, Wiener, Wiener-CE, and ZF) as a function of Pilot Size. The chart visually demonstrates how the MSE changes for each algorithm as the pilot size increases from approximately 0 to 80.
### Components/Axes
* **X-axis:** "Pilot Size" ranging from 0 to 80, with tick marks at intervals of 10.
* **Y-axis:** "MSE" ranging from 0 to 1, with tick marks at intervals of 0.2.
* **Data Series:** Five distinct lines, each representing a different algorithm:
* Capon (Green solid line)
* Kernel (Light Blue solid line)
* Wiener (Red solid line)
* Wiener-CE (Dark Blue dashed line)
* ZF (Magenta solid line)
* **Legend:** Located in the top-right corner of the chart, associating each color with its corresponding algorithm.
### Detailed Analysis
Here's a breakdown of each algorithm's performance based on the chart:
* **Capon (Green):** The line fluctuates significantly, starting at approximately 0.95 at Pilot Size 0, oscillating between roughly 0.75 and 0.95 throughout the range, and ending around 0.9 at Pilot Size 80.
* **Kernel (Light Blue):** The line starts at approximately 0.85 at Pilot Size 0 and decreases to around 0.65 by Pilot Size 80, exhibiting a generally decreasing trend with some fluctuations.
* **Wiener (Red):** The line shows a steep decrease from approximately 0.9 at Pilot Size 0 to around 0.25 at Pilot Size 20. It then plateaus, remaining around 0.2 to 0.25 for the rest of the range, ending at approximately 0.22 at Pilot Size 80.
* **Wiener-CE (Dark Blue):** The line starts at approximately 0.3 at Pilot Size 0 and decreases rapidly to around 0.18 at Pilot Size 20. It then plateaus, remaining around 0.17 to 0.2 for the rest of the range, ending at approximately 0.19 at Pilot Size 80.
* **ZF (Magenta):** The line starts at approximately 0.65 at Pilot Size 0, decreases to around 0.75 at Pilot Size 10, then decreases to approximately 0.55 by Pilot Size 80, exhibiting a generally decreasing trend with some fluctuations.
### Key Observations
* The Wiener and Wiener-CE algorithms achieve the lowest MSE values across the entire range of Pilot Sizes.
* The Capon algorithm exhibits the highest and most volatile MSE values.
* The Kernel and ZF algorithms show moderate MSE values, with a decreasing trend as Pilot Size increases.
* All algorithms demonstrate a significant decrease in MSE as Pilot Size increases from 0 to 20, indicating that increasing the pilot size generally improves performance.
* After Pilot Size 20, the improvement in MSE diminishes for the Wiener and Wiener-CE algorithms, suggesting a point of diminishing returns.
### Interpretation
The chart suggests that the Wiener and Wiener-CE algorithms are the most effective in minimizing MSE for this particular application, especially as the pilot size increases. The Capon algorithm appears to be the least effective, with consistently high MSE values. The performance improvement observed with increasing pilot size indicates that providing more training data (represented by the pilot size) enhances the accuracy of the algorithms. The plateauing of the Wiener and Wiener-CE algorithms after Pilot Size 20 suggests that there is a limit to the benefits of increasing the pilot size beyond a certain point. This could be due to factors such as noise or the inherent limitations of the algorithms themselves. The differences in performance between the algorithms likely stem from their underlying assumptions and methodologies for estimating the signal or reducing noise. The chart provides valuable insights for selecting the most appropriate algorithm and determining the optimal pilot size for a given application.