# Technical Document Extraction: Line Graph Analysis
## Image Description
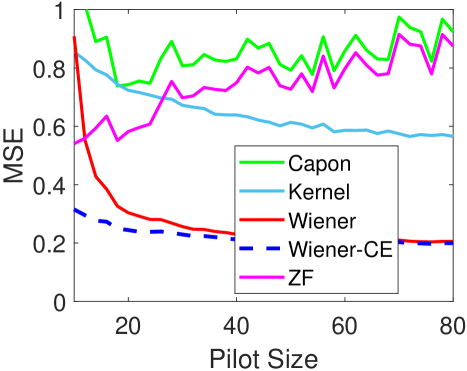
The image is a **line graph** comparing the **Mean Squared Error (MSE)** performance of five algorithms across varying **Pilot Sizes** (0 to 80). The y-axis represents MSE (0 to 1), and the x-axis represents Pilot Size. The graph includes five distinct data series, each represented by a unique color and line style.
---
## Key Components
### 1. **Axis Labels**
- **X-axis**: "Pilot Size" (ranges from 0 to 80 in increments of 20).
- **Y-axis**: "MSE" (ranges from 0 to 1 in increments of 0.2).
### 2. **Legend**
- **Location**: Bottom-right corner of the graph.
- **Labels and Colors**:
- **Capon**: Green solid line.
- **Kernel**: Blue solid line.
- **Wiener**: Red solid line.
- **Wiener-CE**: Dashed blue line.
- **ZF**: Magenta solid line.
### 3. **Data Series Trends
#### a. **Wiener (Red Solid Line)**
- **Trend**: Starts at ~0.9 (Pilot Size 0), sharply declines to ~0.2 by Pilot Size 20, then plateaus near 0.2.
- **Key Points**:
- Pilot Size 0: ~0.9
- Pilot Size 20: ~0.2
- Pilot Size 40: ~0.2
- Pilot Size 60: ~0.2
- Pilot Size 80: ~0.2
#### b. **Wiener-CE (Dashed Blue Line)**
- **Trend**: Starts at ~0.3 (Pilot Size 0), declines to ~0.2 by Pilot Size 20, and remains stable.
- **Key Points**:
- Pilot Size 0: ~0.3
- Pilot Size 20: ~0.2
- Pilot Size 40: ~0.2
- Pilot Size 60: ~0.2
- Pilot Size 80: ~0.2
#### c. **Capon (Green Solid Line)**
- **Trend**: Fluctuates between ~0.7 and ~0.9 throughout the range, with no clear downward trend.
- **Key Points**:
- Pilot Size 0: ~0.8
- Pilot Size 20: ~0.75
- Pilot Size 40: ~0.85
- Pilot Size 60: ~0.8
- Pilot Size 80: ~0.9
#### d. **Kernel (Blue Solid Line)**
- **Trend**: Gradually declines from ~0.8 (Pilot Size 0) to ~0.6 (Pilot Size 80).
- **Key Points**:
- Pilot Size 0: ~0.8
- Pilot Size 20: ~0.7
- Pilot Size 40: ~0.65
- Pilot Size 60: ~0.6
- Pilot Size 80: ~0.6
#### e. **ZF (Magenta Solid Line)**
- **Trend**: Erratic fluctuations between ~0.5 and ~0.8, with no consistent trend.
- **Key Points**:
- Pilot Size 0: ~0.6
- Pilot Size 20: ~0.7
- Pilot Size 40: ~0.75
- Pilot Size 60: ~0.8
- Pilot Size 80: ~0.7
---
## Spatial Grounding
- **Legend Position**: Bottom-right corner (coordinates: [x=70, y=10] relative to the graph's bottom-right edge).
- **Color Consistency**: All line colors match the legend labels exactly.
---
## Observations
1. **Wiener-CE** consistently achieves the lowest MSE across all Pilot Sizes.
2. **Wiener** shows the most significant improvement, dropping from ~0.9 to ~0.2.
3. **Capon** and **ZF** exhibit higher variability, with Capon generally outperforming ZF.
4. **Kernel** demonstrates a steady but moderate decline in MSE.
---
## Conclusion
The graph illustrates the MSE performance of five algorithms as Pilot Size increases. Wiener-CE emerges as the most stable and effective method, while Wiener shows the largest improvement. Capon and ZF display higher variability, with Capon generally outperforming ZF. Kernel provides a moderate, consistent decline in error.