# Technical Document Extraction: Align Module Architecture
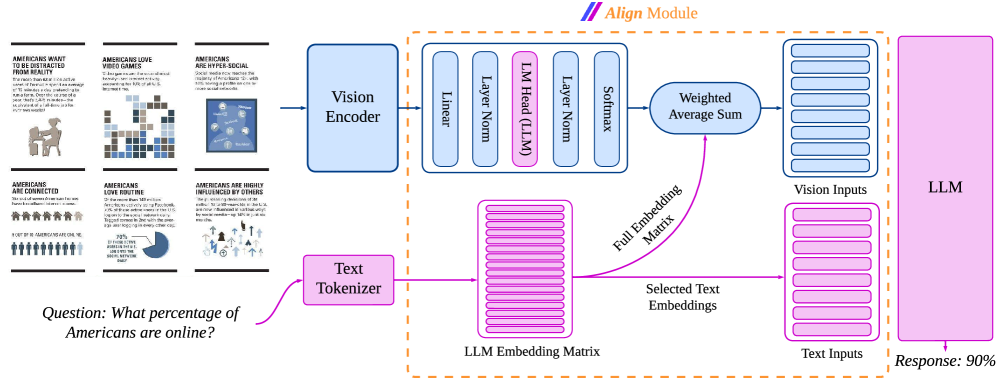
This document provides a comprehensive technical breakdown of the provided architectural diagram, which illustrates a multimodal Large Language Model (LLM) pipeline utilizing an "Align Module" to process visual and textual data.
## 1. Input Data (Left Region)
The system receives two types of inputs: a complex infographic and a natural language question.
### A. Visual Input (Infographic)
The infographic consists of six panels containing text and data visualizations:
1. **Top Left Panel:**
* **Header:** AMERICANS WANT TO BE DISTRACTED FROM REALITY
* **Body Text:** The more than 100 million active users of FarmVille spend an average of 15 minutes a day pretending to run a farm. Over the course of a year, that's 5,475 minutes—the equivalent of a full-time job for over two weeks!
2. **Top Middle Panel:**
* **Header:** AMERICANS LOVE VIDEO GAMES
* **Body Text:** Video games are the most popular form of entertainment in the U.S., accounting for 10% of all U.S. leisure time.
3. **Top Right Panel:**
* **Header:** AMERICANS ARE HYPER-SOCIAL
* **Body Text:** Social media now reaches the majority of Americans (51%), with 30% having a profile on one or more social networks.
4. **Bottom Left Panel:**
* **Header:** AMERICANS ARE CONNECTED
* **Body Text:** The vast of women Americans houses have broadband internet access. [Note: Text contains grammatical errors as transcribed].
* **Sub-statistic:** 9 OUT OF 10 AMERICANS ARE ONLINE. (Accompanied by an icon chart showing 9 blue figures and 1 grey figure).
5. **Bottom Middle Panel:**
* **Header:** AMERICANS LOVE ROUTINE
* **Body Text:** Of the more than 140 million Americans active on Facebook, 70% of those active users in the U.S. log on to the social network daily. Tagged comes in 2nd with the average user logging in every other day.
* **Sub-statistic:** 70% OF THOSE ACTIVE ON FACEBOOK LOG ONTO THE SOCIAL NETWORK DAILY. (Accompanied by a pie chart).
6. **Bottom Right Panel:**
* **Header:** AMERICANS ARE HIGHLY INFLUENCED BY OTHERS
* **Body Text:** The purchasing decisions of 3M million [sic] Americans in the U.S. are now influenced in various ways by social media—up 14% in just six months.
### B. Textual Input (Query)
* **Question:** "What percentage of Americans are online?"
---
## 2. Processing Pipeline (Main Diagram)
The architecture is divided into three primary stages: Encoding, Alignment, and Generation.
### Stage 1: Encoding
* **Vision Encoder (Blue Block):** Receives the infographic image. It outputs a feature representation to the Align Module.
* **Text Tokenizer (Pink Block):** Receives the text question. It converts the string into tokens which are then mapped to the **LLM Embedding Matrix**.
### Stage 2: The Align Module (Central Dashed Orange Box)
This module aligns visual features with the LLM's semantic space.
* **Projection Layer (Top Sequence):** The output from the Vision Encoder passes through a series of layers:
1. **Linear**
2. **Layer Norm**
3. **LM Head (LLM)** (Highlighted in pink, indicating it uses the LLM's own weights).
4. **Layer Norm**
5. **Softmax**
* **Weighted Average Sum:** This component takes the Softmax probabilities and the **Full Embedding Matrix** (sourced from the LLM Embedding Matrix) to calculate a weighted representation of the image.
* **Output Buffers:**
* **Vision Inputs (Blue):** A stack of vectors representing the visual information in the LLM's embedding space.
* **Text Inputs (Pink):** "Selected Text Embeddings" derived directly from the LLM Embedding Matrix based on the input question.
### Stage 3: LLM Generation
* **LLM (Large Pink Block):** Receives the concatenated Vision Inputs and Text Inputs.
* **Response:** The LLM processes the multimodal context to produce the final answer.
* **Output Value:** "Response: 90%" (Derived from the "9 out of 10" statistic in the infographic).
---
## 3. Component Summary Table
| Component | Color Code | Function |
| :--- | :--- | :--- |
| **Vision Path** | Blue | Processes image data into visual tokens. |
| **Text Path** | Pink | Processes query data into text tokens. |
| **Align Module** | Orange (Dashed) | Bridges the gap between visual features and LLM embeddings. |
| **LM Head (LLM)** | Pink (Internal) | Uses the LLM's vocabulary head to project visual features. |
| **LLM** | Pink (Large) | The core reasoning engine that generates the final text output. |
## 4. Logical Flow Summary
1. **Image** is encoded into features.
2. **Question** is tokenized into embeddings.
3. The **Align Module** uses the LLM's own embedding matrix and LM head to transform visual features into "Vision Inputs" that the LLM can understand as if they were text.
4. The **LLM** reads both the Vision Inputs and Text Inputs to find the answer "90%" within the visual data.