## Diagram: Multimodal Alignment Module
### Overview
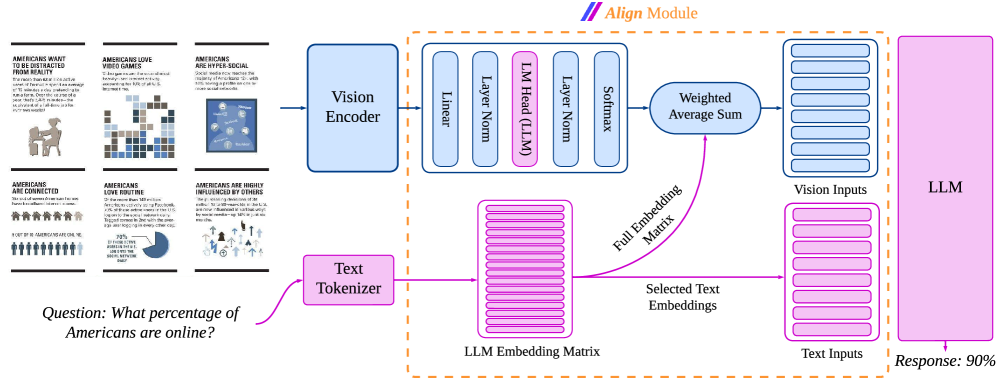
This diagram illustrates a multimodal alignment module that processes both visual (image) and textual data to provide a response via a Large Language Model (LLM). The module takes images and text as input, encodes them, aligns their representations, and then feeds them into the LLM to generate a response. The diagram highlights the flow of information and the key components involved in this process.
### Components/Axes
The diagram is segmented into four main areas: Input Images, Processing Modules, Alignment, and LLM Output.
* **Input Images:** Six images are displayed, each with a title. The titles are:
* "AMERICANS WANT TO BE DISTRACTED FROM REALITY"
* "AMERICANS LOVE VIDEO GAMES"
* "AMERICANS ARE HYPER-SOCIAL"
* "AMERICANS ARE CONNECTED"
* "AMERICANS LOVE ROUTINE"
* "AMERICANS ARE HIGHLY INFLUENCED BY OTHERS"
* **Processing Modules:**
* Vision Encoder (light blue)
* Text Tokenizer (light blue)
* Linear (purple)
* LM Head (LLM) (purple)
* Layer Norm (purple)
* Softmax (purple)
* Weighted Average Sum (light orange)
* **Alignment:**
* Full Embedding Matrix (green)
* **LLM Output:**
* LLM (dark orange)
* Response: 90% (dark orange)
* **Data Flow:** Arrows indicate the direction of data flow between components.
* **Question:** "What percentage of Americans are online?" (bottom-left)
### Detailed Analysis or Content Details
1. **Input Images:** The six images are arranged in a 2x3 grid in the top-left corner. Each image appears to be a visualization of data related to American behaviors and preferences. The specific content within each image is not fully legible, but the titles provide context.
2. **Vision Encoder:** The Vision Encoder receives the input images and transforms them into a visual representation.
3. **Text Tokenizer:** The Text Tokenizer processes the question "What percentage of Americans are online?" and converts it into a numerical representation (embeddings).
4. **Embedding Alignment:** The outputs from the Vision Encoder and Text Tokenizer are then passed through a series of layers: Linear, LM Head (LLM), Layer Norm, and Softmax. These layers likely refine and align the visual and textual embeddings.
5. **Full Embedding Matrix:** The aligned embeddings are then fed into a "Full Embedding Matrix," which appears to be a transformation or projection step.
6. **Weighted Average Sum:** The output of the Full Embedding Matrix is combined with the "Selected Text Embeddings" using a "Weighted Average Sum." This step likely integrates the visual and textual information.
7. **LLM Input:** The combined representation (Vision Inputs and Text Inputs) is then fed into the LLM.
8. **LLM Output:** The LLM generates a response, which in this case is "90%."
### Key Observations
* The diagram emphasizes the alignment of visual and textual data.
* The use of multiple layers (Linear, LM Head, Layer Norm, Softmax) suggests a complex alignment process.
* The "Weighted Average Sum" indicates that both visual and textual information contribute to the final LLM input.
* The LLM provides a specific answer (90%) to the question, demonstrating the effectiveness of the multimodal alignment.
### Interpretation
This diagram illustrates a system for multimodal reasoning, where an LLM leverages both visual and textual information to answer questions. The system aims to bridge the gap between different modalities (images and text) by aligning their representations in a shared embedding space. The "Align Module" is the core of this process, using a series of transformations and combinations to integrate the visual and textual data. The final output (90%) suggests that the system can accurately interpret the visual information in the images and combine it with the textual question to provide a relevant and informative answer. The diagram highlights the potential of multimodal LLMs to perform complex reasoning tasks that require understanding both visual and textual cues. The question itself suggests a focus on understanding societal trends and behaviors based on visual data. The fact that the LLM can provide a percentage suggests that the visual data contains quantifiable information that can be interpreted to answer the question.