TECHNICAL ASSET FINGERPRINT
455197b3287bb15f8d2ec35a
Click to view fullscreen
Press ESC or click to close
FOUND IN PAPERS
EXPERT: healer-alpha-free VERSION 1
RUNTIME: free/openrouter/healer-alpha
INTEL_VERIFIED
\n
## System Architecture Diagram: Multimodal Alignment Module
### Overview
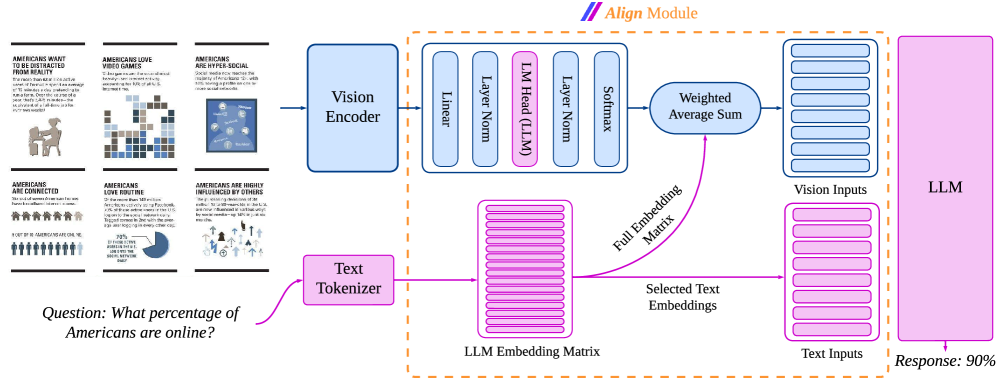
This image is a technical system architecture diagram illustrating the data flow and processing pipeline for a multimodal AI model. It specifically details how visual inputs (infographics) and a text-based question are processed, aligned, and fed into a Large Language Model (LLM) to generate a response. The diagram emphasizes an "Align Module" that integrates vision and text embeddings.
### Components/Axes
The diagram is organized into a left-to-right flow with distinct processing pathways for vision and text, which converge in a central alignment module.
**1. Input Examples (Left Side):**
* Six small infographic panels are shown as example visual inputs. Each has a title and a graphic.
* Top Row (Left to Right):
* "AMERICANS WANT TO BE PROTECTED FROM BEING SCAMMED" (Image: A person at a desk with a shield).
* "AMERICANS LOVE VIDEO GAMES" (Image: A grid of pixelated icons).
* "AMERICANS ARE HYPER-SOCIAL" (Image: A network diagram of connected people).
* Bottom Row (Left to Right):
* "AMERICANS ARE CONNECTED" (Image: A row of stylized people icons).
* "AMERICANS LOVE ROUTINE" (Image: A pie chart).
* "AMERICANS ARE HIGHLY INFLUENCED BY OTHERS" (Image: A flowchart with icons).
* Below these panels is a text question: **"Question: What percentage of Americans are online?"**
**2. Vision Processing Pathway (Blue):**
* **Vision Encoder:** A blue box that receives the visual inputs (the infographics).
* **Align Module (Vision Sub-Path):** A dashed orange box labeled **"Align Module"** at the top. Inside, the vision pathway continues:
* A sequence of processing layers: `Linear` -> `Layer Norm` -> `LM Head (LLM)` (highlighted in pink) -> `Layer Norm` -> `Softmax`.
* The output goes to a **"Weighted Average Sum"** block.
* The final output is a stack of blue rectangles labeled **"Vision Inputs"**.
**3. Text Processing Pathway (Pink):**
* **Text Tokenizer:** A pink box that receives the text question.
* **LLM Embedding Matrix:** A large pink block representing the model's embedding space.
* **Align Module (Text Sub-Path):** Within the same dashed orange box:
* A pink arrow labeled **"Full Embedding Matrix"** points from the LLM Embedding Matrix to the "Weighted Average Sum" block in the vision path.
* Another pink arrow labeled **"Selected Text Embeddings"** points from the LLM Embedding Matrix to a stack of pink rectangles labeled **"Text Inputs"**.
**4. Integration and Output (Right Side):**
* The **"Vision Inputs"** (blue stack) and **"Text Inputs"** (pink stack) are shown as parallel inputs feeding into a large pink box labeled **"LLM"**.
* An arrow points from the LLM box to the final output: **"Response: 90%"**.
### Detailed Analysis
The diagram meticulously maps the transformation of raw multimodal data into a format suitable for an LLM.
* **Flow & Relationships:** The core process involves two parallel streams:
1. **Vision Stream:** Raw images -> Vision Encoder -> Alignment processing (Linear, Norm, LM Head, Softmax) -> Weighted Average -> Vision Embeddings.
2. **Text Stream:** Raw text question -> Tokenizer -> Lookup in LLM Embedding Matrix -> Selected Text Embeddings.
* **The Align Module's Role:** This is the critical junction. It uses the **"Full Embedding Matrix"** (from the text model's knowledge) to inform the **"Weighted Average Sum"** operation on the vision features. This suggests the module aligns visual features with the semantic space of the language model. The "LM Head (LLM)" layer within the vision pathway is a key indicator of this cross-modal alignment.
* **Spatial Grounding:** The "Align Module" label is centered at the top of the dashed box. The "Weighted Average Sum" is positioned in the upper-right quadrant of this module. The "Vision Inputs" and "Text Inputs" stacks are vertically aligned to the right of the Align Module, clearly showing they are the final, aligned products ready for the LLM.
* **Component Isolation:**
* **Header/Inputs:** The left third defines the problem space (visual context + specific query).
* **Main Processing:** The central two-thirds detail the encoding and alignment mechanics.
* **Footer/Output:** The right side shows the output.
The diagram does not contain numerical data charts or graphs. It is a process flow diagram. Therefore, there are no numerical data points, trends, or outliers to extract. The only quantitative value is the final model output: **"90%"**.
### Key Observations
1. **Asymmetric Processing:** The vision pathway undergoes more explicit, multi-step transformation (Linear, Norm, Head, Softmax, Weighted Average) before becoming "Vision Inputs," while the text pathway appears to involve a more direct selection from the embedding matrix.
2. **Central Role of the LLM Embedding Matrix:** This matrix is not just for text; it actively guides the alignment of visual features via the "Full Embedding Matrix" connection, indicating a deeply integrated multimodal design.
3. **Purpose-Built for Question Answering:** The entire pipeline is framed around answering a specific question about the visual input, as demonstrated by the sample question and the direct "Response: 90%" output.
### Interpretation
This diagram illustrates a sophisticated architecture for a **visually-grounded language model**. The system doesn't just process an image and a question separately; it actively *aligns* the visual information with the linguistic and conceptual space of the LLM before any reasoning occurs.
The "Align Module" is the key innovation shown. By using the LLM's own embedding matrix to weight and select relevant visual features, the model ensures that the "Vision Inputs" it ultimately sees are already primed to be relevant to the textual query and the LLM's internal knowledge. This is a Peircean investigative process: the visual data (the sign, or *representamen*) of the infographics is interpreted (aligned) through the lens of the LLM's conceptual framework (the interpretant) to produce a meaningful answer (the object, which is the fact "90%").
The final "Response: 90%" to the question "What percentage of Americans are online?" implies that one of the input infographics (likely "AMERICANS ARE CONNECTED" or "AMERICANS ARE HYPER-SOCIAL") contained this specific data point, and the model successfully extracted and reported it. The architecture is designed to make such extraction robust by ensuring visual features are contextually relevant before the LLM ever processes them.
DECODING INTELLIGENCE...