\n
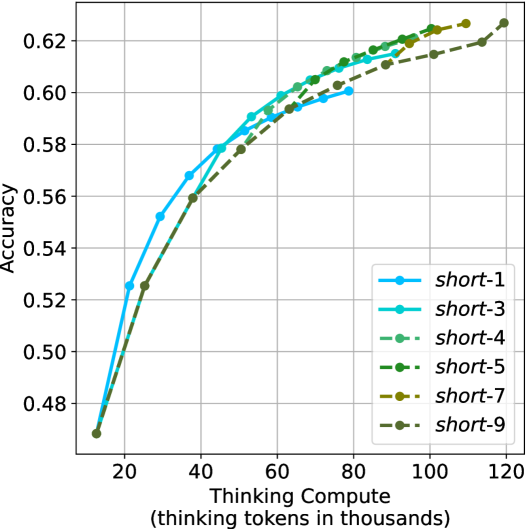
## Line Chart: Accuracy vs. Thinking Compute
### Overview
The image presents a line chart illustrating the relationship between "Thinking Compute" (measured in thousands of tokens) and "Accuracy" for six different models labeled "short-1" through "short-9". The chart shows how accuracy increases with increasing compute for each model.
### Components/Axes
* **X-axis:** "Thinking Compute (thinking tokens in thousands)". Scale ranges from approximately 0 to 120, with markers at 20, 40, 60, 80, 100, and 120.
* **Y-axis:** "Accuracy". Scale ranges from approximately 0.48 to 0.63, with markers at 0.48, 0.50, 0.52, 0.54, 0.56, 0.58, 0.60, and 0.62.
* **Legend:** Located in the top-right corner, listing the following models with corresponding colors:
* short-1 (Blue)
* short-3 (Teal)
* short-4 (Dark Green)
* short-5 (Light Green)
* short-7 (Dark Brown)
* short-9 (Orange)
* **Grid:** A light gray grid is present in the background to aid in reading values.
### Detailed Analysis
Here's a breakdown of each line's trend and approximate data points. All values are approximate due to the chart's resolution.
* **short-1 (Blue):** The line slopes upward, showing a positive correlation between compute and accuracy.
* At 20k tokens: ~0.49 accuracy
* At 40k tokens: ~0.57 accuracy
* At 60k tokens: ~0.59 accuracy
* At 80k tokens: ~0.61 accuracy
* At 100k tokens: ~0.62 accuracy
* At 120k tokens: ~0.62 accuracy
* **short-3 (Teal):** The line also slopes upward, but starts slightly higher than short-1.
* At 20k tokens: ~0.51 accuracy
* At 40k tokens: ~0.59 accuracy
* At 60k tokens: ~0.60 accuracy
* At 80k tokens: ~0.61 accuracy
* At 100k tokens: ~0.62 accuracy
* At 120k tokens: ~0.62 accuracy
* **short-4 (Dark Green):** The line slopes upward, starting higher than short-3.
* At 20k tokens: ~0.52 accuracy
* At 40k tokens: ~0.60 accuracy
* At 60k tokens: ~0.61 accuracy
* At 80k tokens: ~0.62 accuracy
* At 100k tokens: ~0.62 accuracy
* At 120k tokens: ~0.62 accuracy
* **short-5 (Light Green):** The line slopes upward, starting higher than short-4.
* At 20k tokens: ~0.53 accuracy
* At 40k tokens: ~0.60 accuracy
* At 60k tokens: ~0.61 accuracy
* At 80k tokens: ~0.62 accuracy
* At 100k tokens: ~0.62 accuracy
* At 120k tokens: ~0.62 accuracy
* **short-7 (Dark Brown):** The line slopes upward, starting lower than short-5.
* At 20k tokens: ~0.49 accuracy
* At 40k tokens: ~0.58 accuracy
* At 60k tokens: ~0.60 accuracy
* At 80k tokens: ~0.61 accuracy
* At 100k tokens: ~0.62 accuracy
* At 120k tokens: ~0.62 accuracy
* **short-9 (Orange):** The line slopes upward, starting lower than short-7.
* At 20k tokens: ~0.48 accuracy
* At 40k tokens: ~0.57 accuracy
* At 60k tokens: ~0.59 accuracy
* At 80k tokens: ~0.61 accuracy
* At 100k tokens: ~0.62 accuracy
* At 120k tokens: ~0.62 accuracy
### Key Observations
* All models demonstrate increasing accuracy with increasing "Thinking Compute".
* The accuracy gains appear to diminish as compute increases, suggesting a point of diminishing returns. The lines flatten out at higher compute values.
* The models "short-4" and "short-5" achieve the highest accuracy levels, reaching approximately 0.62.
* Models "short-1" and "short-9" start with the lowest accuracy and show a slightly slower rate of improvement.
### Interpretation
The chart demonstrates the impact of computational resources ("Thinking Compute") on the performance ("Accuracy") of different models. The consistent upward trend across all models suggests that increasing compute generally leads to improved accuracy. However, the flattening of the curves at higher compute levels indicates that there's a limit to the benefits of simply adding more compute.
The differences between the models ("short-1" to "short-9") likely represent variations in model architecture, training data, or other hyperparameters. The superior performance of "short-4" and "short-5" suggests that these models are more efficient at utilizing the available compute to achieve higher accuracy.
The chart is valuable for understanding the trade-offs between computational cost and model performance. It suggests that while increasing compute is beneficial, it's also important to optimize model design to maximize the efficiency of resource utilization. The diminishing returns observed at higher compute levels highlight the need for alternative strategies to further improve accuracy, such as exploring different model architectures or training techniques.