## Line Chart: Accuracy vs. Thinking Compute for Different "Short" Configurations
### Overview
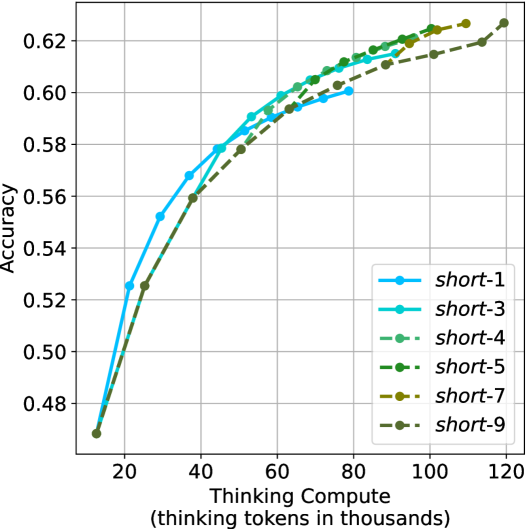
The image displays a line chart plotting model accuracy against computational cost, measured in thinking tokens. It compares six different configurations labeled "short-1" through "short-9". The chart demonstrates a clear positive correlation between increased compute and accuracy, with all lines showing a logarithmic-like growth pattern that begins to plateau at higher compute levels.
### Components/Axes
* **Chart Type:** Multi-line chart with markers.
* **X-Axis:**
* **Title:** `Thinking Compute (thinking tokens in thousands)`
* **Scale:** Linear, ranging from approximately 10 to 120 (thousand tokens).
* **Major Tick Marks:** 20, 40, 60, 80, 100, 120.
* **Y-Axis:**
* **Title:** `Accuracy`
* **Scale:** Linear, ranging from approximately 0.47 to 0.63.
* **Major Tick Marks:** 0.48, 0.50, 0.52, 0.54, 0.56, 0.58, 0.60, 0.62.
* **Legend:**
* **Position:** Bottom-right corner of the plot area.
* **Content:** Six entries, each with a unique color, line style, and marker.
1. `short-1`: Solid, bright cyan line with circular markers.
2. `short-3`: Solid, medium turquoise line with circular markers.
3. `short-4`: Dashed, medium sea green line with circular markers.
4. `short-5`: Dashed, dark green line with circular markers.
5. `short-7`: Dashed, olive/brown line with circular markers.
6. `short-9`: Dashed, dark olive green line with circular markers.
* **Grid:** Light gray grid lines are present for both major x and y ticks.
### Detailed Analysis
**Trend Verification & Data Points (Approximate):**
All six data series follow a similar trajectory: a steep initial rise in accuracy as compute increases from ~10k to ~40k tokens, followed by a gradual flattening of the curve (diminishing returns) as compute approaches 120k tokens.
1. **`short-1` (Cyan, Solid):**
* **Trend:** The leftmost and initially highest-performing line. It rises steeply and then plateaus earlier than others.
* **Data Points:** (~10k, 0.47), (~20k, 0.525), (~30k, 0.55), (~40k, 0.57), (~50k, 0.58), (~60k, 0.59), (~70k, 0.595), (~80k, 0.60). It ends near 80k tokens.
2. **`short-3` (Turquoise, Solid):**
* **Trend:** Follows a path very close to, but slightly below, `short-1` in the mid-range. It extends further along the x-axis.
* **Data Points:** (~10k, 0.47), (~20k, 0.52), (~30k, 0.55), (~40k, 0.57), (~50k, 0.58), (~60k, 0.59), (~70k, 0.60), (~80k, 0.605), (~90k, 0.61), (~100k, 0.615).
3. **`short-4` (Sea Green, Dashed):**
* **Trend:** Starts lower than the solid lines but crosses above them in the high-compute region (>80k tokens), achieving one of the highest final accuracies.
* **Data Points:** (~10k, 0.47), (~20k, 0.51), (~30k, 0.54), (~40k, 0.56), (~50k, 0.575), (~60k, 0.59), (~70k, 0.60), (~80k, 0.61), (~90k, 0.615), (~100k, 0.62), (~110k, 0.625).
4. **`short-5` (Dark Green, Dashed):**
* **Trend:** Very similar path to `short-4`, running just below it for most of the range.
* **Data Points:** (~10k, 0.47), (~20k, 0.51), (~30k, 0.54), (~40k, 0.56), (~50k, 0.575), (~60k, 0.585), (~70k, 0.595), (~80k, 0.605), (~90k, 0.61), (~100k, 0.615), (~110k, 0.62).
5. **`short-7` (Olive, Dashed):**
* **Trend:** The lowest-performing line for most of the compute range, but it continues to rise steadily and ends at a high point.
* **Data Points:** (~10k, 0.47), (~20k, 0.51), (~30k, 0.535), (~40k, 0.555), (~50k, 0.57), (~60k, 0.58), (~70k, 0.59), (~80k, 0.60), (~90k, 0.605), (~100k, 0.61), (~110k, 0.615), (~120k, 0.62).
6. **`short-9` (Dark Olive, Dashed):**
* **Trend:** Closely follows `short-7`, often overlapping or running just below it.
* **Data Points:** (~10k, 0.47), (~20k, 0.51), (~30k, 0.535), (~40k, 0.555), (~50k, 0.57), (~60k, 0.58), (~70k, 0.59), (~80k, 0.60), (~90k, 0.605), (~100k, 0.61), (~110k, 0.615), (~120k, 0.62).
### Key Observations
1. **Diminishing Returns:** All configurations show that the gain in accuracy per additional thousand thinking tokens decreases significantly after approximately 40-60k tokens.
2. **Performance Hierarchy:** At low-to-mid compute (20k-60k tokens), the solid-line configurations (`short-1`, `short-3`) outperform the dashed-line ones. However, at high compute (>80k tokens), the dashed-line configurations (`short-4`, `short-5`) achieve equal or slightly higher accuracy.
3. **Convergence:** The performance gap between the best and worst configurations narrows as compute increases. At ~120k tokens, the spread in accuracy is much smaller than at ~40k tokens.
4. **Endpoint Variation:** The configurations terminate at different maximum compute levels (e.g., `short-1` at ~80k, `short-4` at ~110k, `short-7/9` at ~120k), suggesting different computational budgets or stopping criteria.
### Interpretation
This chart illustrates a fundamental trade-off in AI model inference: **accuracy versus computational cost**. The data suggests that:
* **Investing compute yields better results, but with diminishing returns.** The most cost-effective gains are made in the early phase (up to ~40k thinking tokens). Pushing beyond this requires substantially more compute for smaller improvements.
* **The optimal configuration depends on the available budget.** For applications with strict latency or cost constraints (low compute budget), `short-1` or `short-3` are superior choices. For applications where maximum accuracy is paramount and compute is less constrained, `short-4` or `short-5` become the better options, as they continue to improve at higher token counts.
* **The "short-X" label likely represents a model or prompting configuration parameter.** The consistent ordering and behavior suggest that lower numbers (1, 3) may be optimized for efficiency, while higher numbers (4, 5, 7, 9) may be optimized for peak performance, trading off initial efficiency for higher ultimate accuracy. The near-identical performance of `short-7` and `short-9` indicates a potential performance ceiling for this family of configurations.