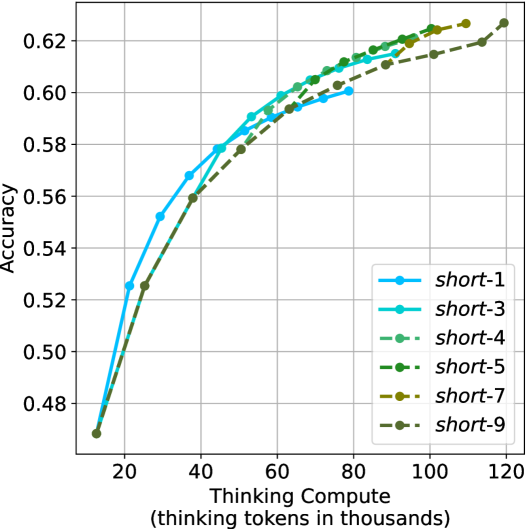
## Line Chart: Accuracy vs. Thinking Compute (Thinking Tokens in Thousands)
### Overview
The chart illustrates the relationship between model accuracy and computational effort (measured in "thinking tokens in thousands") across nine distinct configurations labeled "short-1" to "short-9". All lines originate from the same baseline accuracy (~0.48) at 20k tokens and exhibit upward trends as computational effort increases, converging toward higher accuracy values (~0.62–0.64) at 120k tokens.
### Components/Axes
- **Y-Axis**: Accuracy (ranging from 0.48 to 0.62, with gridlines at 0.50, 0.52, 0.54, 0.56, 0.58, 0.60, 0.62).
- **X-Axis**: Thinking Compute (Thinking Tokens in Thousands) (ranging from 20 to 120, with gridlines at 20, 40, 60, 80, 100, 120).
- **Legend**: Located in the bottom-right corner, mapping line styles/colors to labels:
- `short-1`: Blue line with circle markers.
- `short-3`: Cyan line with square markers.
- `short-4`: Light green line with triangle markers.
- `short-5`: Dark green line with diamond markers.
- `short-7`: Yellow line with pentagon markers.
- `short-9`: Gray line with star markers.
### Detailed Analysis
1. **Line Trends**:
- All lines show a **sigmoidal growth pattern**, starting near 0.48 accuracy at 20k tokens and plateauing near 0.62–0.64 at 120k tokens.
- `short-9` (gray) achieves the highest final accuracy (~0.64), followed by `short-7` (~0.63), `short-5` (~0.62), and `short-3` (~0.61).
- `short-1` (blue) underperforms consistently, reaching only ~0.58 accuracy at 120k tokens.
- Lines for `short-4` (light green) and `short-5` (dark green) overlap significantly in the mid-range (40k–80k tokens).
2. **Key Data Points**:
- At 40k tokens:
- `short-1`: ~0.56
- `short-3`: ~0.57
- `short-9`: ~0.57
- At 80k tokens:
- `short-5`: ~0.61
- `short-7`: ~0.62
- `short-9`: ~0.62
- At 120k tokens:
- `short-9`: ~0.64
- `short-7`: ~0.63
- `short-5`: ~0.62
### Key Observations
- **Performance Gradient**: Higher-numbered "short" configurations (e.g., `short-7`, `short-9`) outperform lower-numbered ones (e.g., `short-1`, `short-3`), suggesting a correlation between configuration complexity and accuracy.
- **Diminishing Returns**: Accuracy improvements slow significantly after 80k tokens, with most lines plateauing within ±0.01 of their final values.
- **Convergence**: By 120k tokens, all lines cluster tightly between 0.60 and 0.64, indicating minimal differentiation in performance at maximum compute.
### Interpretation
The data demonstrates that **increased computational effort (thinking tokens)** improves model accuracy across all configurations, with higher-numbered "short" variants achieving superior results. The convergence of lines at higher token counts suggests that **differences in model architecture or training efficiency** (encoded in the "short-X" labels) become less impactful as compute scales. The underperformance of `short-1` implies it may lack critical components (e.g., layers, parameters) present in other configurations. This trend aligns with broader ML principles where compute and model complexity jointly drive performance, but with diminishing returns at scale.