## Line Graph: Loss Value vs. Epoch for Training Methods
### Overview
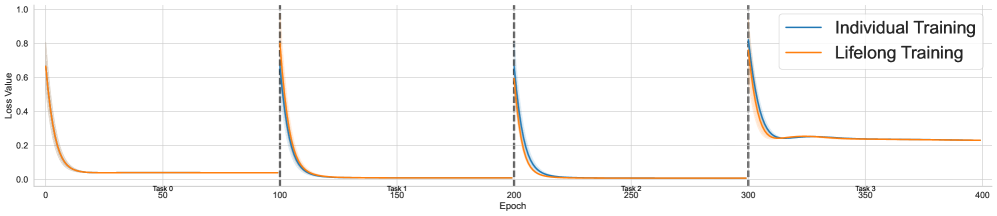
The graph compares the loss value decay over epochs for two training approaches: **Individual Training** (blue line) and **Lifelong Training** (orange line). Three task boundaries are marked at 100, 200, and 300 epochs with vertical dashed lines. Loss values range from 0.0 to 1.0 on the y-axis, while epochs span 0 to 400 on the x-axis.
---
### Components/Axes
- **X-axis (Epoch)**: Labeled "Epoch" with markers at 0, 50, 100, 150, 200, 250, 300, 350, 400.
- **Y-axis (Loss Value)**: Labeled "Loss Value" with increments of 0.2 (0.0, 0.2, 0.4, 0.6, 0.8, 1.0).
- **Legend**: Located in the top-right corner. Blue = Individual Training; Orange = Lifelong Training.
- **Task Markers**: Vertical dashed lines at 100 (Task 0), 200 (Task 1), and 300 (Task 2).
---
### Detailed Analysis
1. **Individual Training (Blue Line)**:
- **Initial Drop**: Starts near 0.8 at epoch 0, dropping sharply to ~0.1 by epoch 50.
- **Task Transitions**:
- At Task 0 (100 epochs): Loss spikes to ~0.7 before dropping to ~0.15 by epoch 150.
- At Task 1 (200 epochs): Loss rises to ~0.6 before falling to ~0.1 by epoch 250.
- At Task 2 (300 epochs): Loss peaks at ~0.8 before declining to ~0.25 by epoch 350.
- **Final Value**: Stabilizes near 0.25 at epoch 400.
2. **Lifelong Training (Orange Line)**:
- **Initial Drop**: Begins at ~0.65, falling to ~0.05 by epoch 50.
- **Task Transitions**:
- Task 0 (100 epochs): Loss rises slightly to ~0.1 before dropping to ~0.05 by epoch 150.
- Task 1 (200 epochs): Loss increases to ~0.15 before falling to ~0.05 by epoch 250.
- Task 2 (300 epochs): Loss rises to ~0.2 before stabilizing at ~0.15 by epoch 350.
- **Final Value**: Remains near 0.15 at epoch 400.
---
### Key Observations
- Both methods show **loss reduction over time**, but Lifelong Training maintains **lower loss values** after each task.
- **Individual Training** exhibits **sharp spikes** at task boundaries (100, 200, 300 epochs), suggesting temporary performance degradation.
- **Lifelong Training** demonstrates **smoother adaptation**, with smaller loss increases during task transitions.
- Final loss values at epoch 400: ~0.25 (Individual) vs. ~0.15 (Lifelong).
---
### Interpretation
The data suggests **Lifelong Training** outperforms Individual Training in **long-term retention** and **adaptation to new tasks**. The spikes in Individual Training at task boundaries indicate **catastrophic forgetting**, where prior knowledge is lost when learning new tasks. In contrast, Lifelong Training’s gradual loss decay implies **better generalization** and **memory preservation**. This aligns with the hypothesis that lifelong learning frameworks mitigate forgetting by continuously updating models without discarding prior knowledge.