## Chart: Accuracy vs. Thinking Compute
### Overview
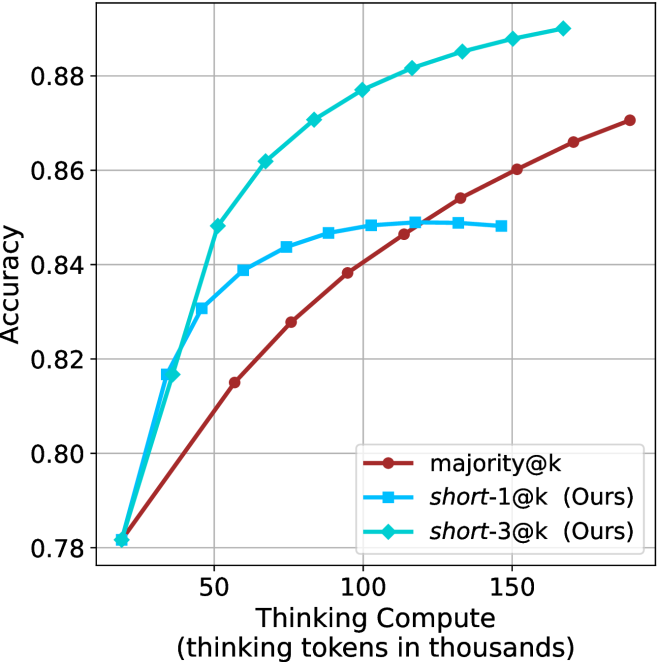
The image presents a line chart illustrating the relationship between "Thinking Compute" (measured in thousands of tokens) and "Accuracy" for three different methods: `majority@k`, `short-1@k (Ours)`, and `short-3@k (Ours)`. The chart aims to demonstrate how performance (accuracy) improves with increased computational resources (thinking tokens).
### Components/Axes
* **X-axis:** "Thinking Compute (thinking tokens in thousands)". Scale ranges from approximately 0 to 175, with markers at 0, 50, 100, and 150.
* **Y-axis:** "Accuracy". Scale ranges from approximately 0.78 to 0.89, with markers at 0.78, 0.80, 0.82, 0.84, 0.86, and 0.88.
* **Legend:** Located in the top-right corner. Contains the following labels and corresponding colors:
* `majority@k` - Reddish-brown line with circular markers.
* `short-1@k (Ours)` - Light blue line with circular markers.
* `short-3@k (Ours)` - Teal line with circular markers.
* **Gridlines:** Present to aid in reading values.
### Detailed Analysis
* **majority@k (Reddish-brown):** The line starts at approximately (0, 0.79) and exhibits a gradually increasing trend, reaching approximately (175, 0.87). The slope is relatively constant throughout.
* (0, 0.79)
* (50, 0.82)
* (100, 0.85)
* (150, 0.865)
* (175, 0.87)
* **short-1@k (Ours) (Light blue):** This line demonstrates a steep initial increase, starting at approximately (0, 0.78) and rapidly climbing to around (50, 0.85). The rate of increase slows down after 50, leveling off around (175, 0.87).
* (0, 0.78)
* (50, 0.85)
* (100, 0.86)
* (150, 0.865)
* (175, 0.87)
* **short-3@k (Ours) (Teal):** This line shows the most rapid increase, beginning at approximately (0, 0.78) and quickly reaching a plateau around (100, 0.88). The line remains relatively flat from 100 to 175.
* (0, 0.78)
* (50, 0.85)
* (100, 0.88)
* (150, 0.875)
* (175, 0.88)
### Key Observations
* `short-3@k (Ours)` consistently outperforms the other two methods across all values of "Thinking Compute".
* `short-1@k (Ours)` initially shows a faster increase in accuracy than `majority@k`, but the difference diminishes as "Thinking Compute" increases.
* All three methods exhibit diminishing returns in accuracy as "Thinking Compute" increases beyond 100.
* The initial accuracy for all methods is approximately the same (around 0.78).
### Interpretation
The chart suggests that increasing the amount of "Thinking Compute" (tokens) generally improves accuracy for all three methods. However, the "short-3@k (Ours)" method demonstrates the most significant gains in accuracy, particularly at lower values of "Thinking Compute". This indicates that this method is more efficient in utilizing computational resources to achieve higher performance. The diminishing returns observed at higher "Thinking Compute" values suggest that there is a point beyond which additional computation provides only marginal improvements in accuracy. The "majority@k" method appears to be the least effective, consistently lagging behind the other two methods. The "Ours" designation suggests these are novel methods being compared to a baseline. The rapid initial gains of the "short-1@k" and "short-3@k" methods could be due to the model quickly learning essential patterns, while the slower gains of "majority@k" might indicate a less efficient learning process.